It’s Time to Set Shared
Medical-Commercial Goals
to Accelerate Treatment
Measure and reward team collaboration to create a
connected flow of information and resources
Medical and commercial teams working together are more successful in delivering the scientific
information healthcare professionals (HCPs) need to treat patients. Pulse data has shown that
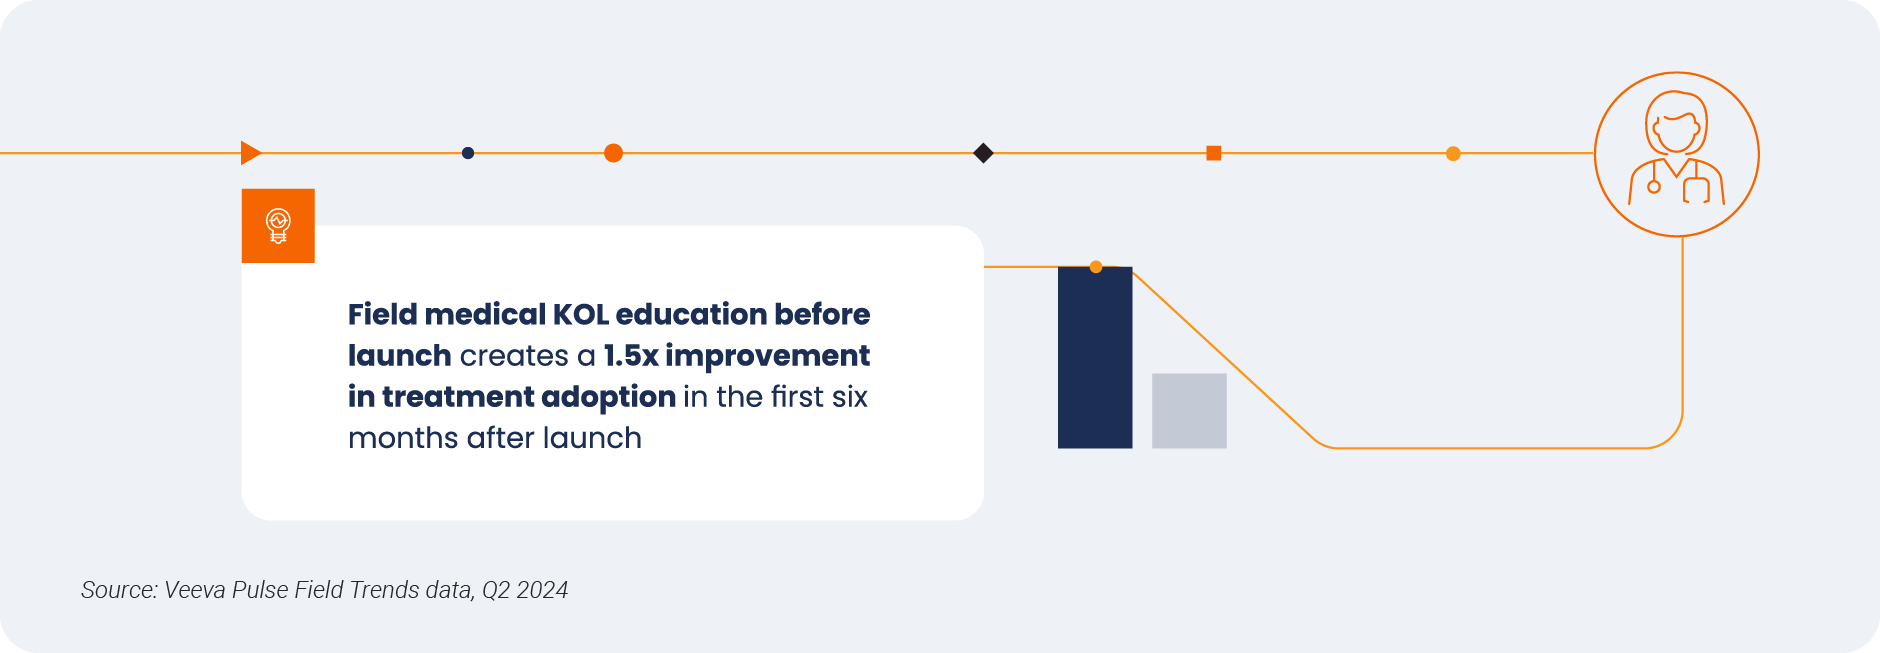
pre-launch field medical education improves adoption by 50% during the first six months of launch.
The ability to connect deep, scientific dialogue with the resources and education that commercial
pulls through is an impactful combination.
But most medical and commercial teams operate in silos. Executives surveyed from top 20
biopharma organizations stated that the HCP experience across medical and commercial is
disconnected, inconsistent, and not timely.1
Amid shorter commercialization windows and more complex science, HCPs expect a connected flow
of information and resources. Medical and commercial alignment, with a shared set of objectives,
will deliver an optimal customer experience, ultimately improving patient care.
“Going beyond traditional KPIs for medical and commercial teams can release the superpower
the functions have when working in full sync,” says Andreas Gerloff, director, medical excellence
operations, Daiichi Sankyo Europe GmbH.
Executive sponsorship helps functional leaders and teams address silos and compliance concerns.
Start with shared KPIs and then pull through process and incentive changes. A collaborative
organizational structure with a connected data foundation better automates sequencing across
roles for a more cohesive approach that accelerates treatment adoption.

Dan Rizzo
VP, Global Head of Business Consulting

1 Veeva focus group with biopharma executives, April 2025
Shared goals accelerate the customer journey;
AI strengthens teaming through connected insights
When medical and commercial teams work together to build stakeholder knowledge and trust,
they accelerate the delivery of information and resources required to help patients (Figure 1).
Field medical education prior to launch improves treatment adoption by 50%. However, with the
growing number of industry challenges — such as increased therapeutic complexity and shorter
launch windows — most of the industry is struggling to create a connected flow of information for
customers across medical and commercial.
Figure 1: Medical education significantly impacts launch success
Misaligned incentives across medical and commercial functions are also a barrier — very few
organizations have established metrics for jointly serving stakeholders with aligned messages in
a coordinated way. By tracking and rewarding compliant handoffs, teams can create shared KPIs
that promote efficient communication and improve the customer experience.
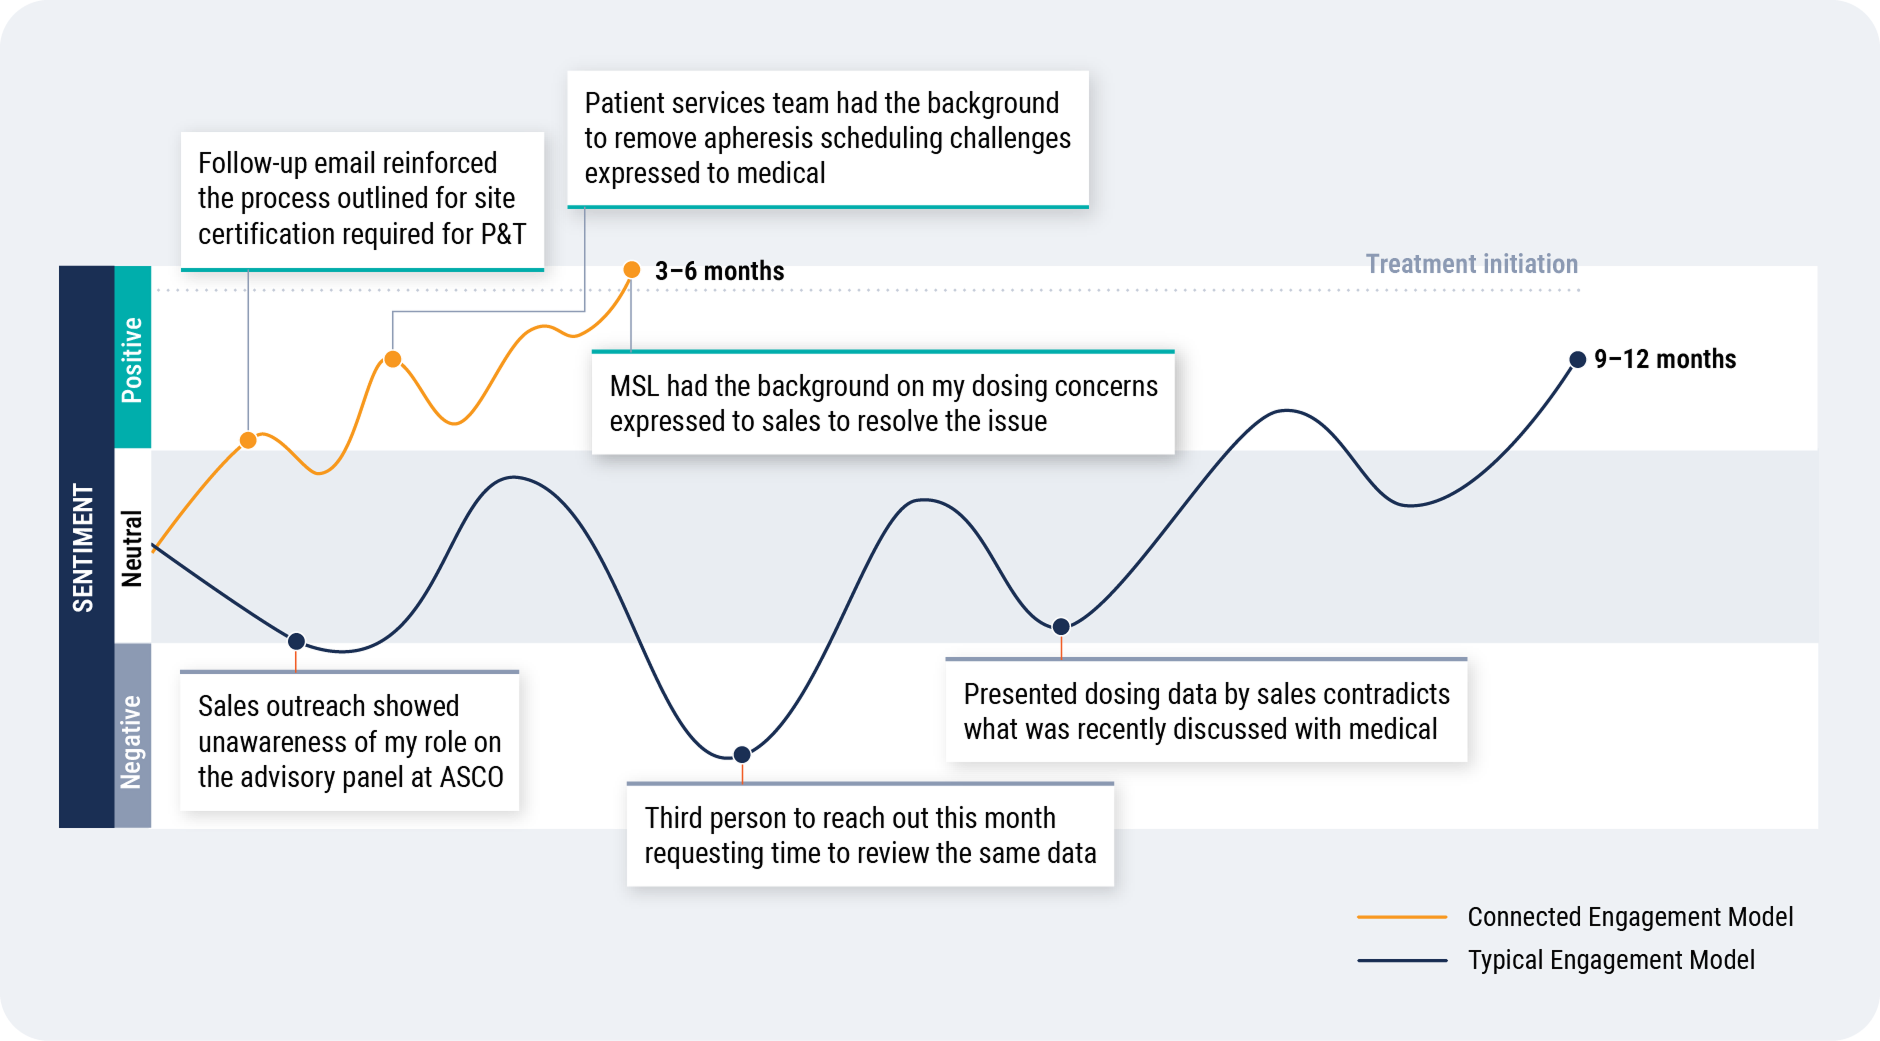
HCPs and patients have a better experience when teams align equally to metrics, encouraging
collaboration and faster exchange of scientific information (Figure 2).
Creating joint KPIs also sets up AI success to power connected engagement. The entrance of AI has
the potential to deliver true customer centricity through more automated teaming, surfacing insights
and content where each interaction informs the next.
Figure 2: Shared goals rewarding faster journey progression accelerates treatment
71% of leaders say operating models are the main barrier
Seventy-one percent of top 20 biopharma executives say their operating model, not compliance,
prevents effective medical-commercial collaboration.2
Setting shared medical-commercial goals to speed scientific exchange and ultimately patient
treatment requires support from the top. Executive sponsorship is required to steer teams toward
joint goals and clear up misconceptions about compliance firewalls.
“There’s very little compliance disallows when measuring medical impact. Every company has
policies and procedures — and this is where fear and grayness can creep in,” says Rina Newton,
compliance consultant and co-founder of Code Clarity. While compliance professionals can help
remove unnecessary hurdles to collaboration and advise on shared KPIs, establishing the culture
and operations that create common objectives falls to the executive level.
Start with shared goals, then pull through process and
incentive changes
A cultural and operational shift of this size requires time for larger organizations, while smaller
and pre-commercial biopharmas have an opportunity to set up connected models fast and early.
For both segments, there are key steps to put this into practice.
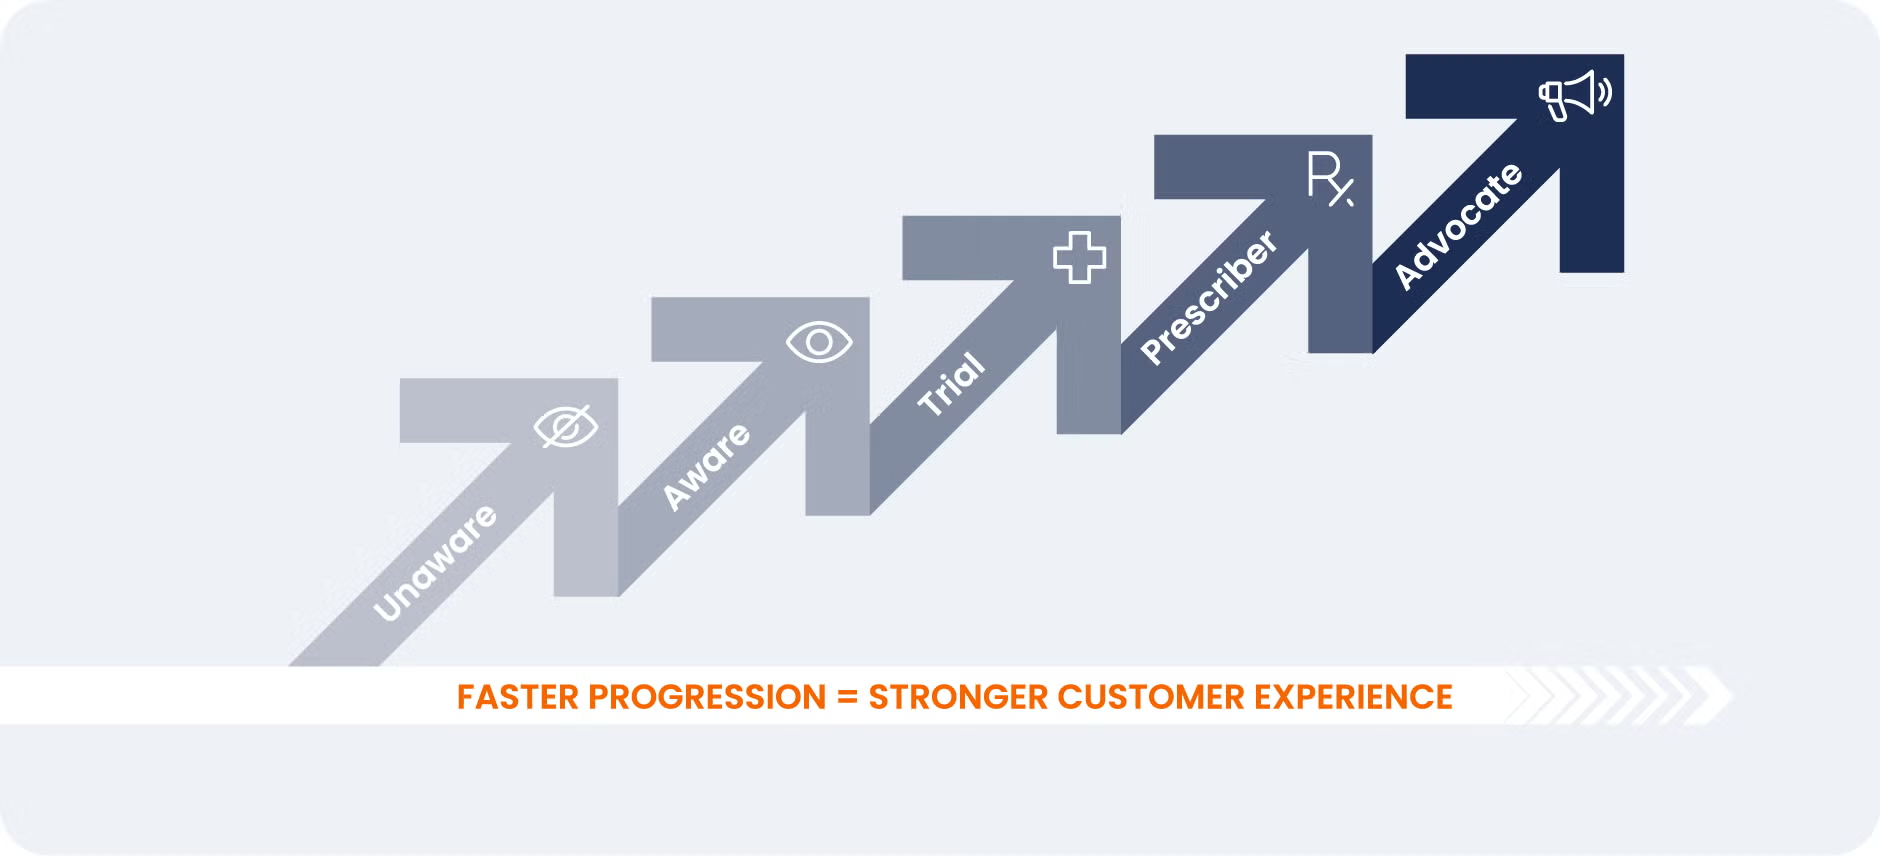
- Align teams around shared KPIs built around the rate of progression along the customer journey to ultimately benefit patients.
- Invest in communication and change management. Place real effort behind helping medical and commercial teams buy into the vision: creating the most efficient customer experience to support patient treatment.
- Update legacy processes that hinder collaboration and involve compliance early. Ensure your AI
investments are supported by quality data and that teams are trained to use these tools properly
for a customer-centric approach. - Regularly celebrate early successes with internal communication and meaningful rewards.
Over time, shift the incentive model from sales-based to one that measures customer journey
progression. This new approach will align incentives with a better customer experience and
serve as a leading indicator of future success.
Ensure your medical and commercial teams align to create the impact that
matters most with Veeva Business Consulting’s in-depth analysis.
2Veeva focus group with biopharma executives, April 2025
Global and Regional Trends
This report highlights global and regional field engagement trends from Veeva Pulse data gathered between July 2024 and June 2025. Veeva Pulse data is sourced from Veeva’s aggregated CRM activity, including field engagement stats from all instances of Veeva CRM globally. In this report, comparisons in trending charts are year over year, Q2 2024 to Q2 2025, while non-trending charts contain quarter-over-quarter comparisons, Q1 2025 to Q2 2025.
Global trends*
Figure 1: Channel mix evolution, global
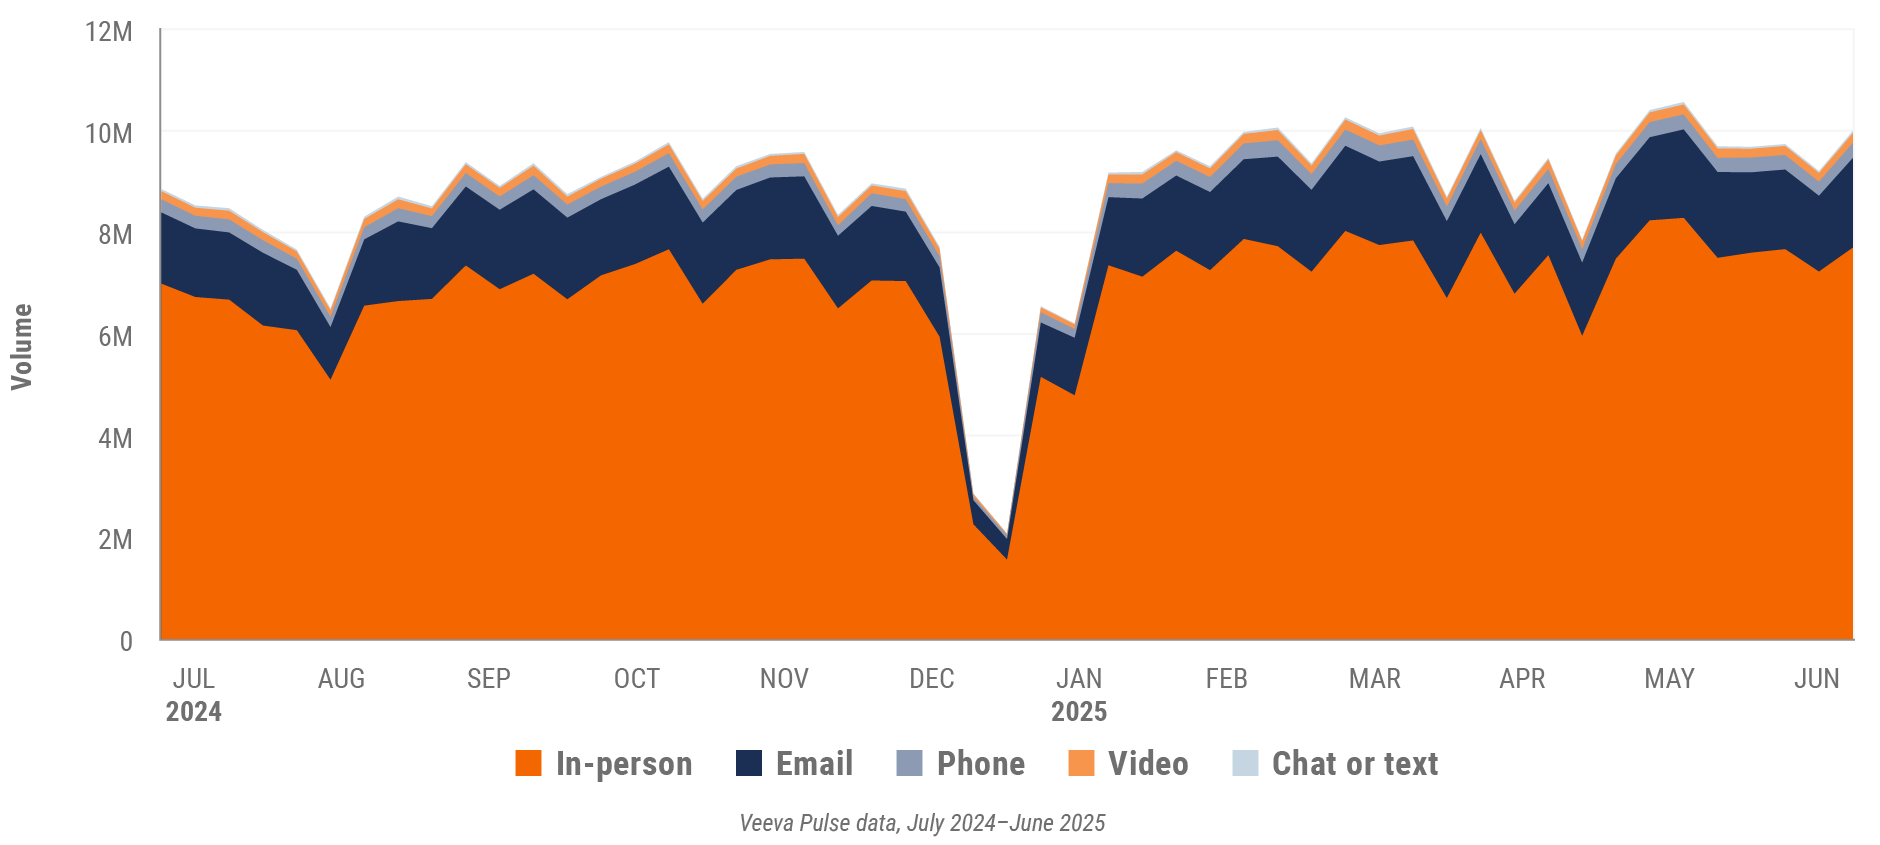
Figure 2: Channel mix, global

Global field team activity
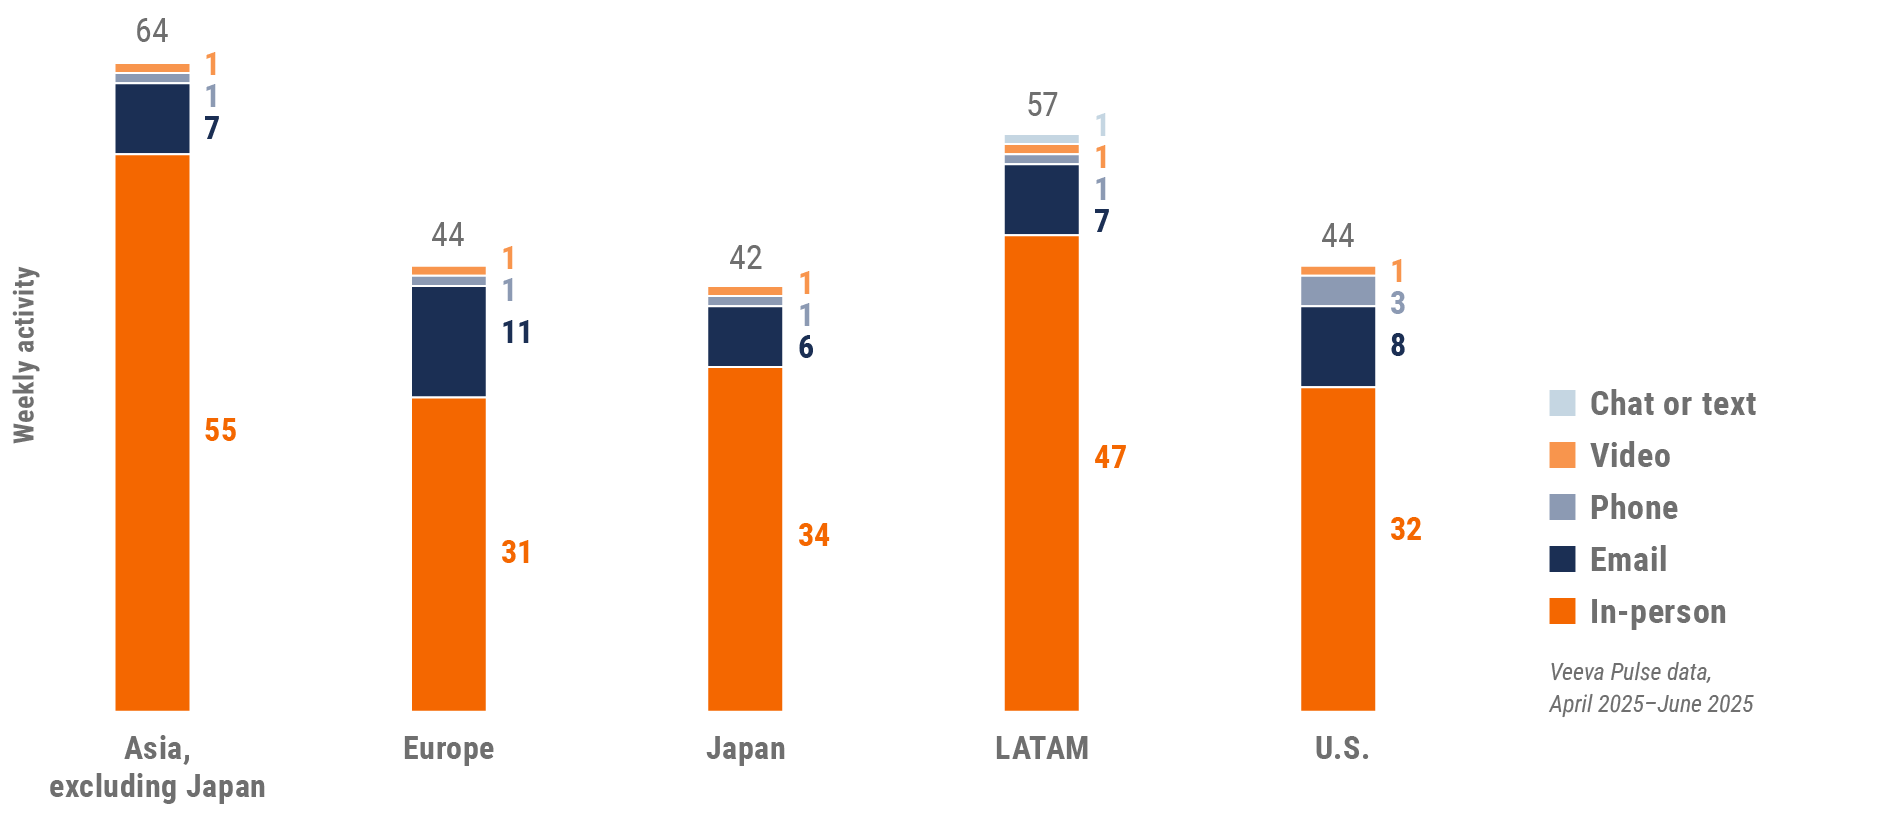
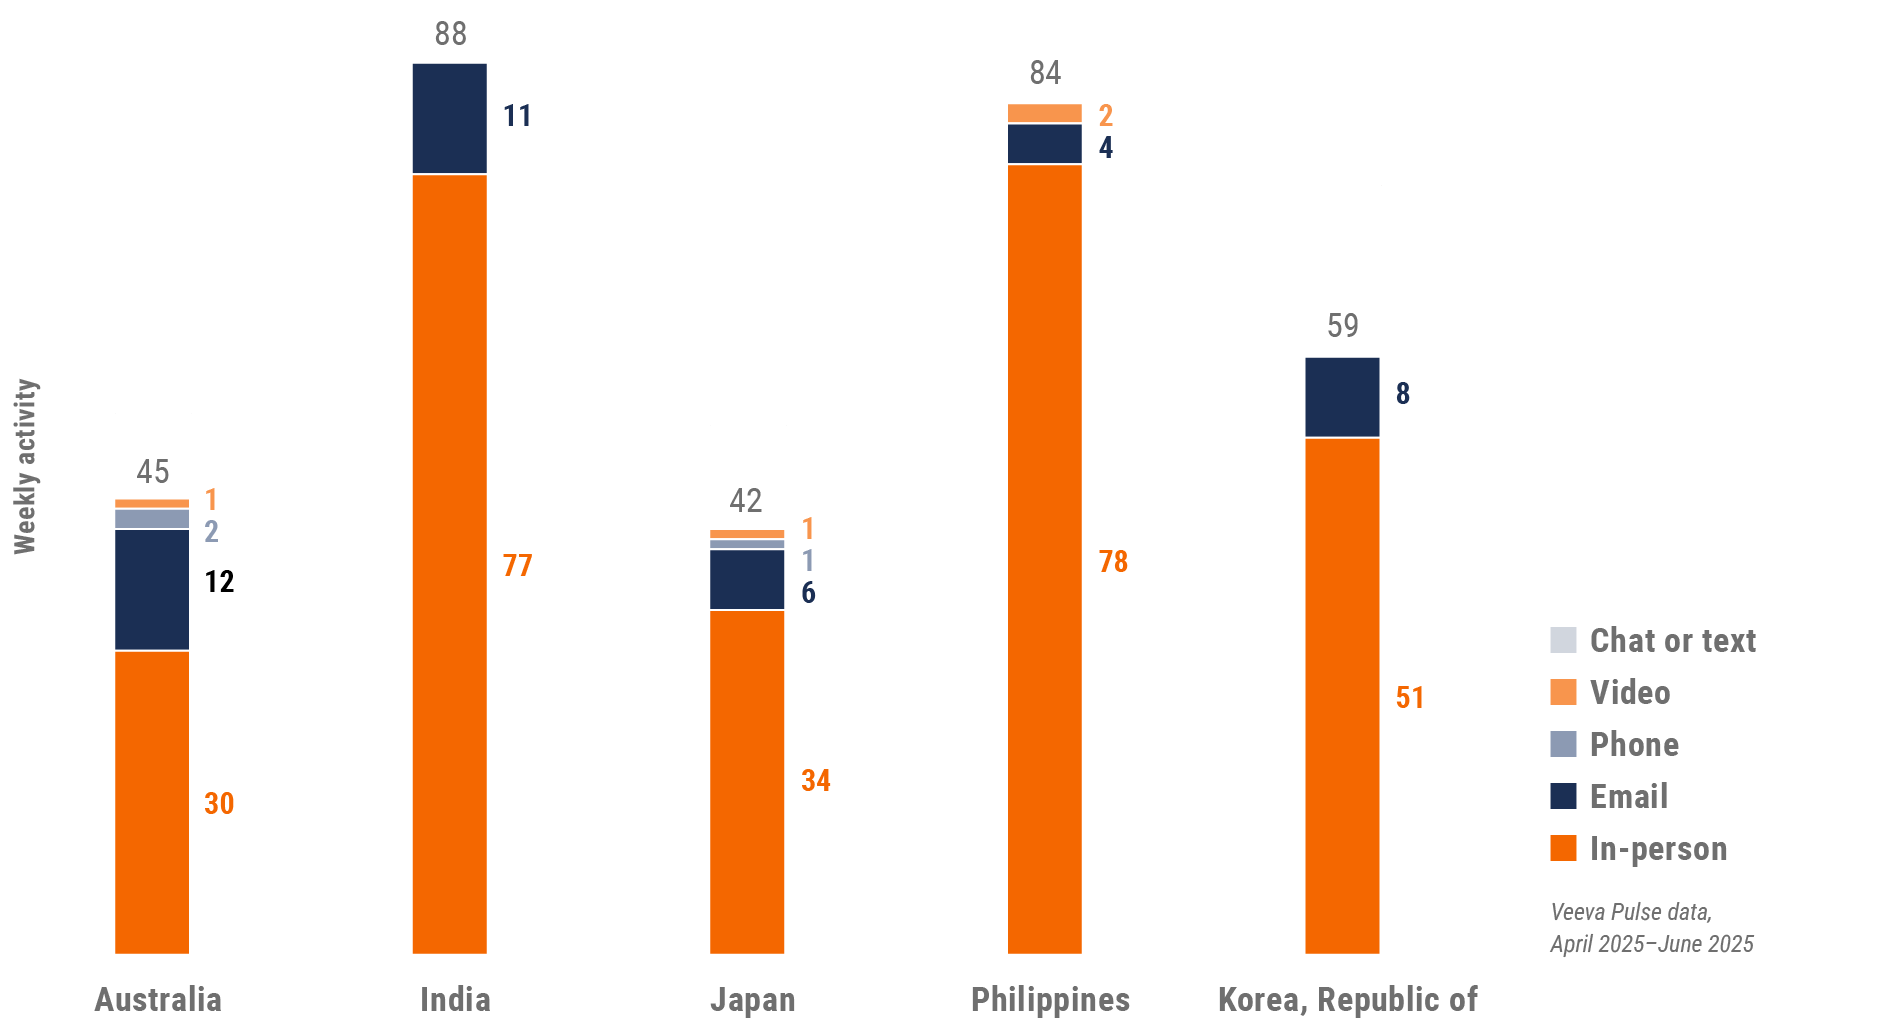
Weekly activity per user by engagement channel
Figure 3: Activity by region, global
Global engagement quality
Consolidation of key quality metrics
Figure 4: Approved email volume, global
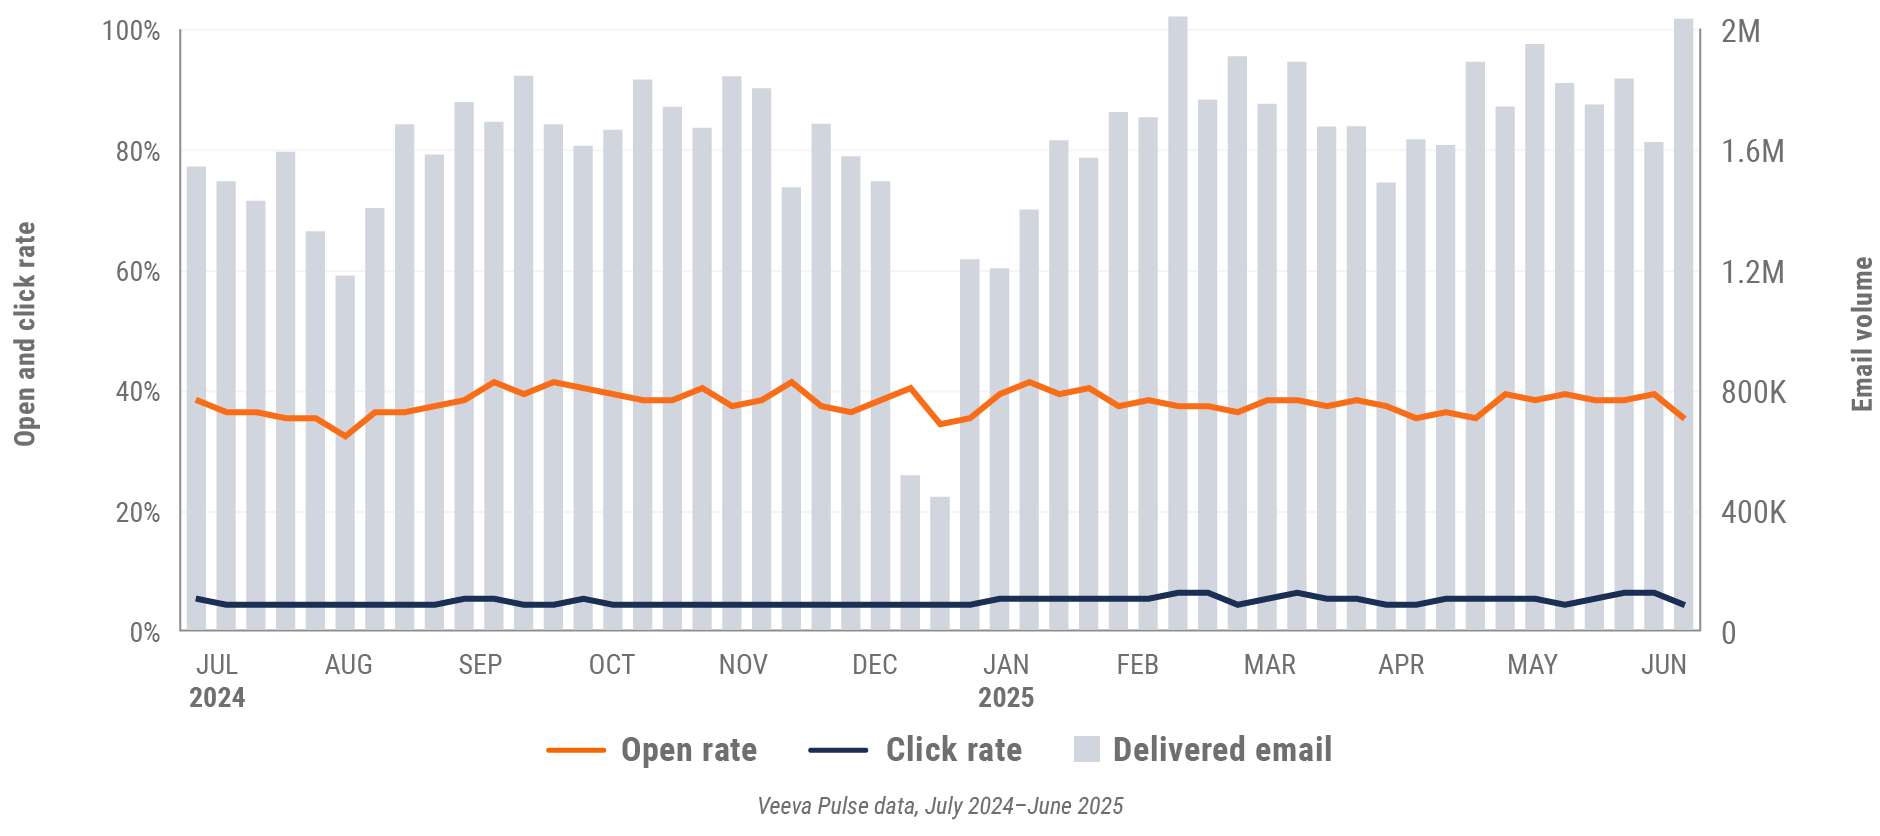
Figure 5: Content usage by channel, global
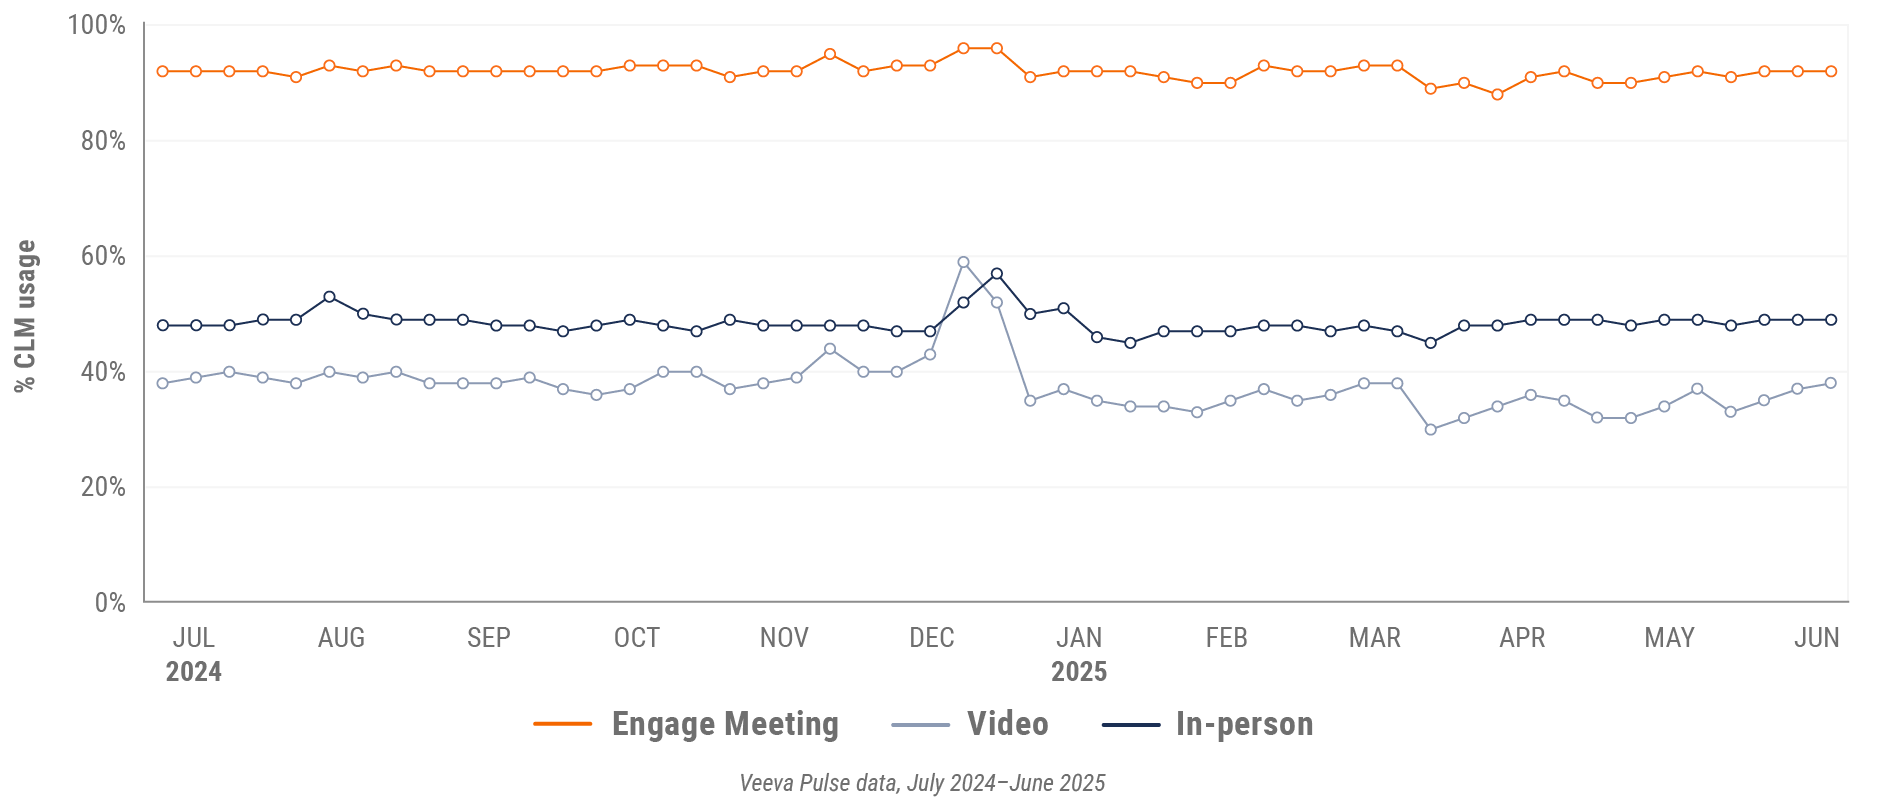
Figure 6: Veeva CRM Engage meeting duration, global

*This quarter’s global trends report omits data from China.
U.S. market trends
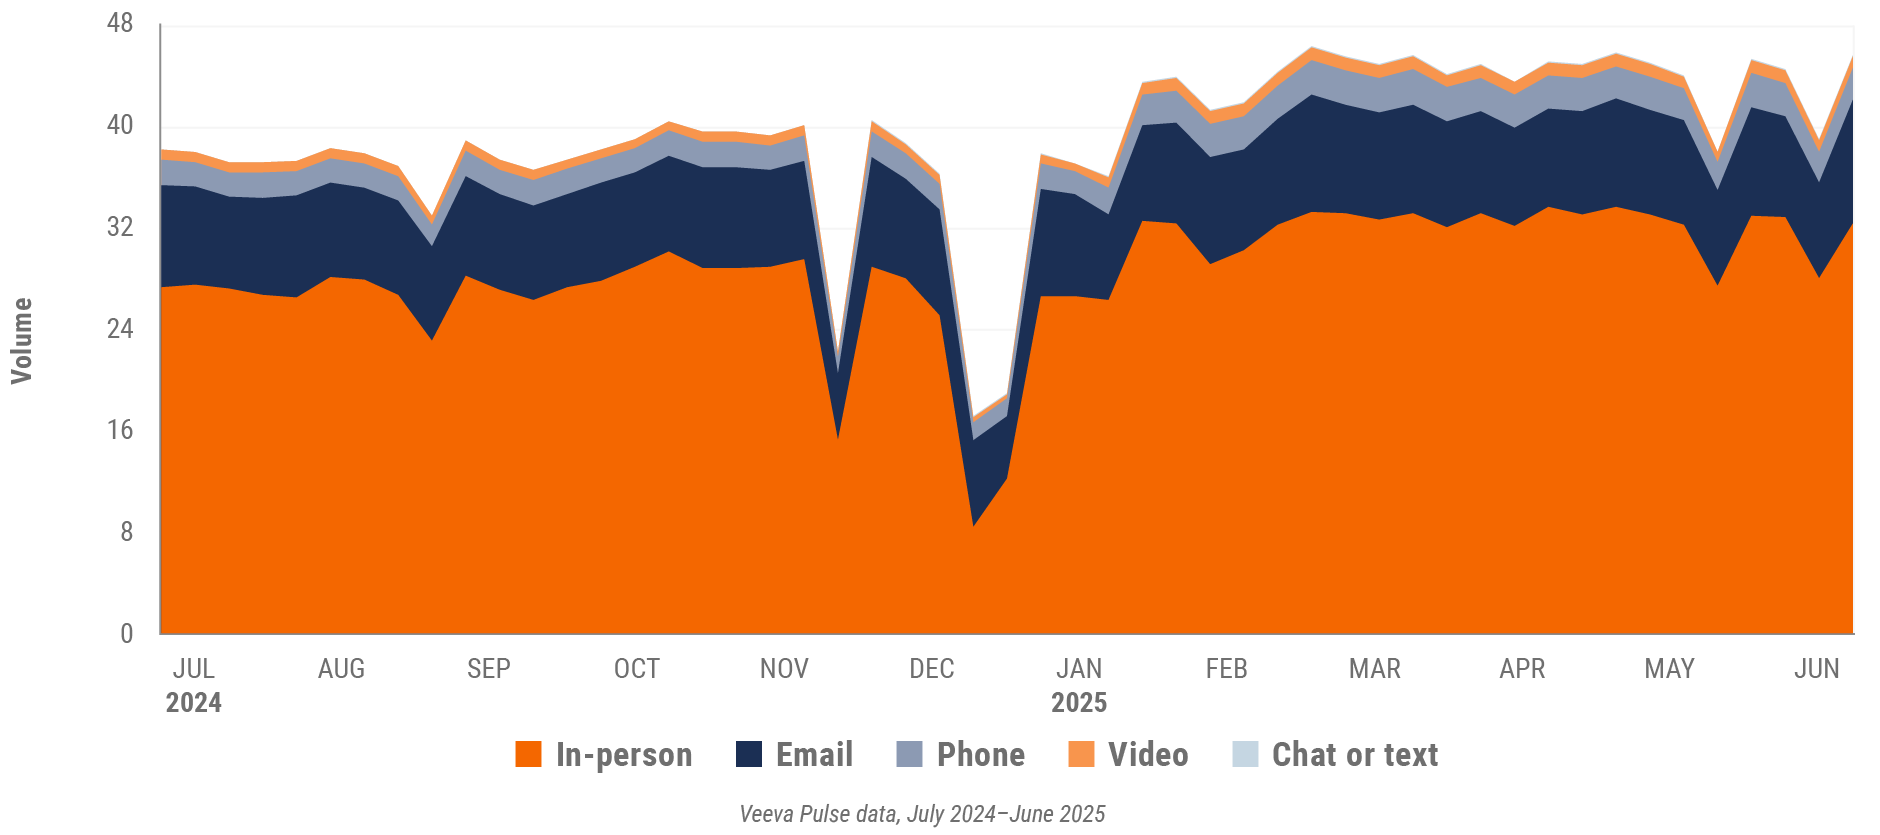
Figure 7: Channel mix evolution, U.S.
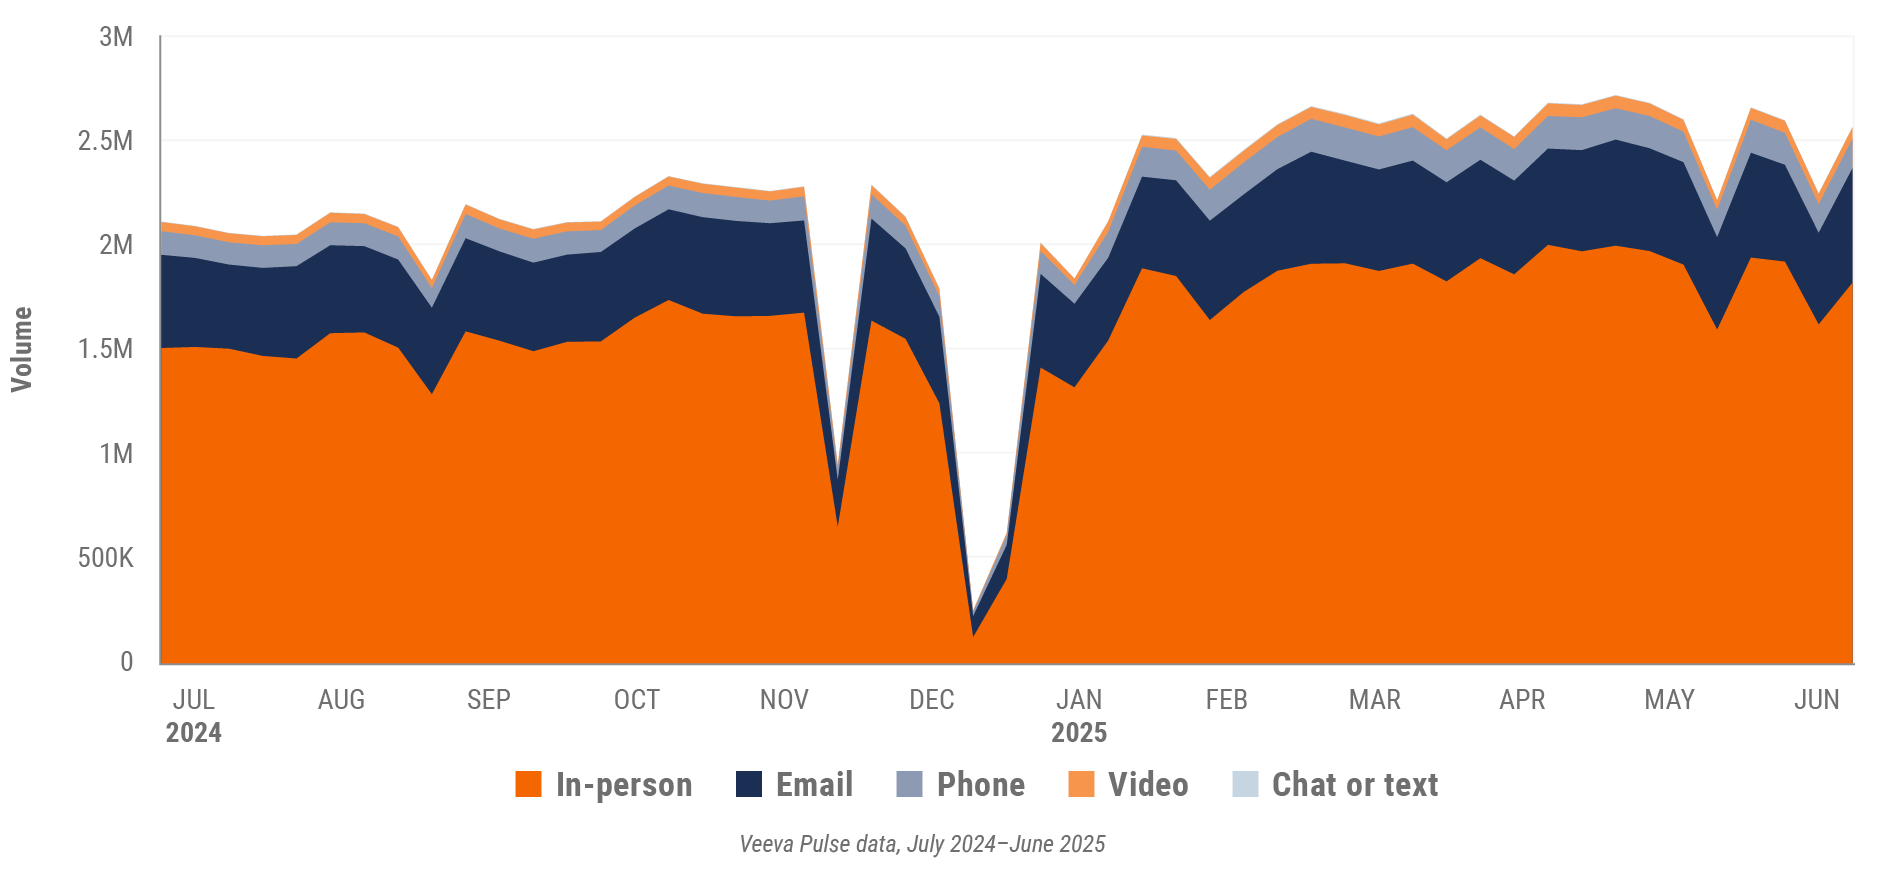
Figure 8: Channel mix, U.S.

U.S. field team activity
Weekly activity per user by engagement channel
Figure 9: Activity, U.S.
U.S. engagement quality
Consolidation of key quality metrics
Figure 10: Approved email volume, U.S.
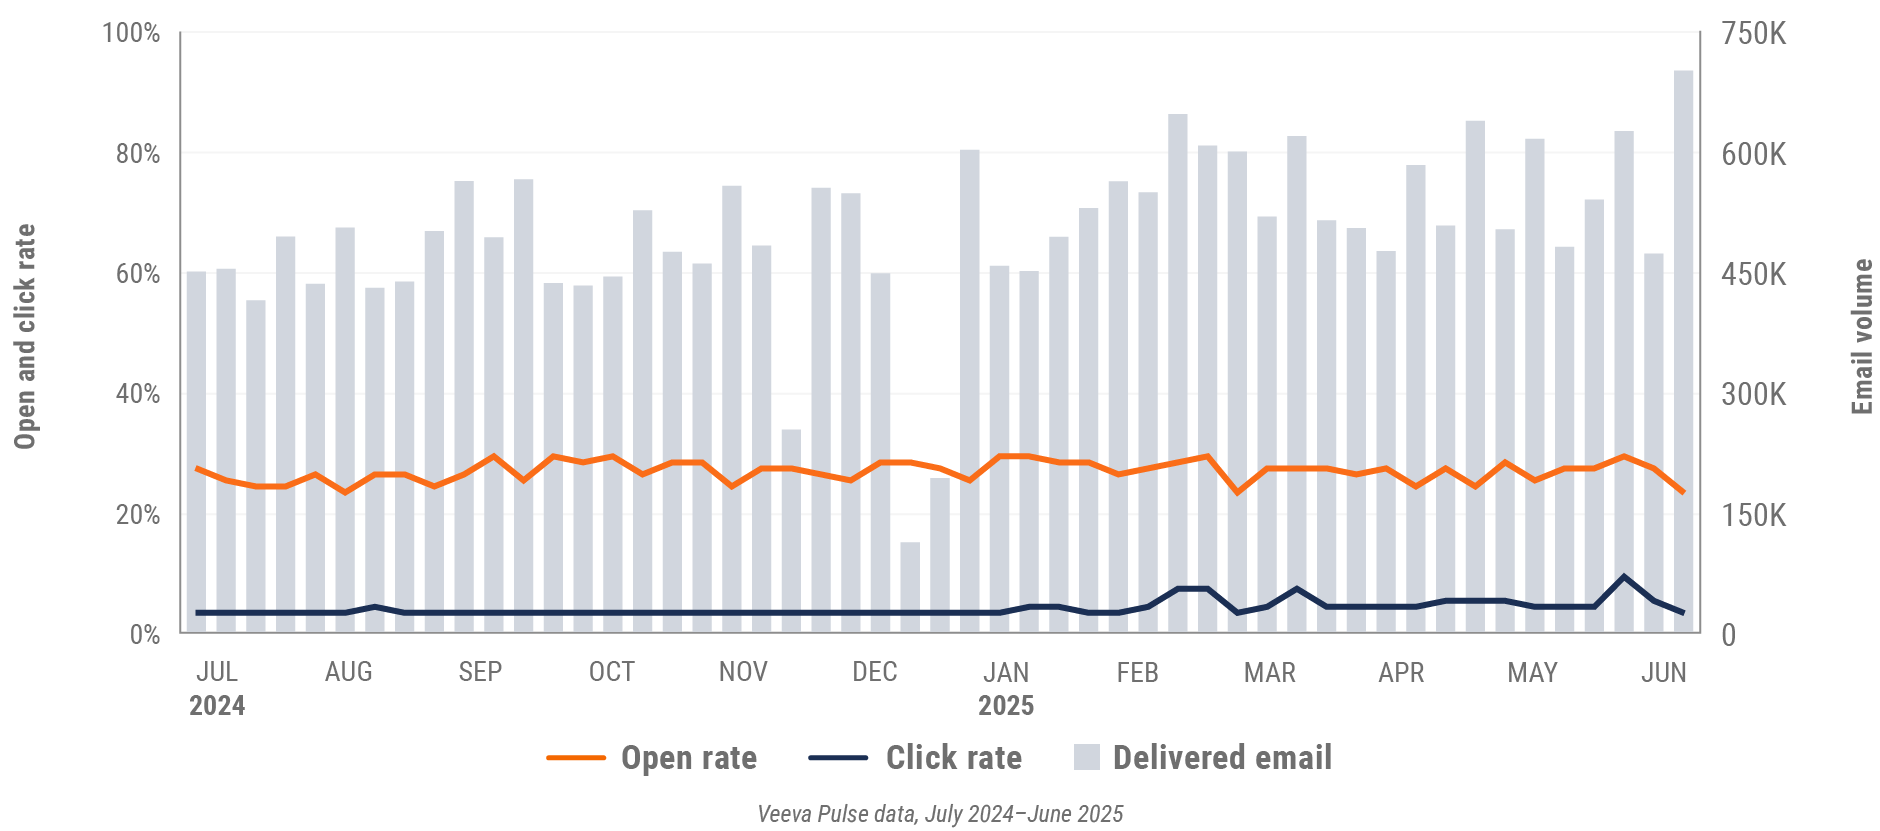
Figure 11: Content usage by channel, U.S.
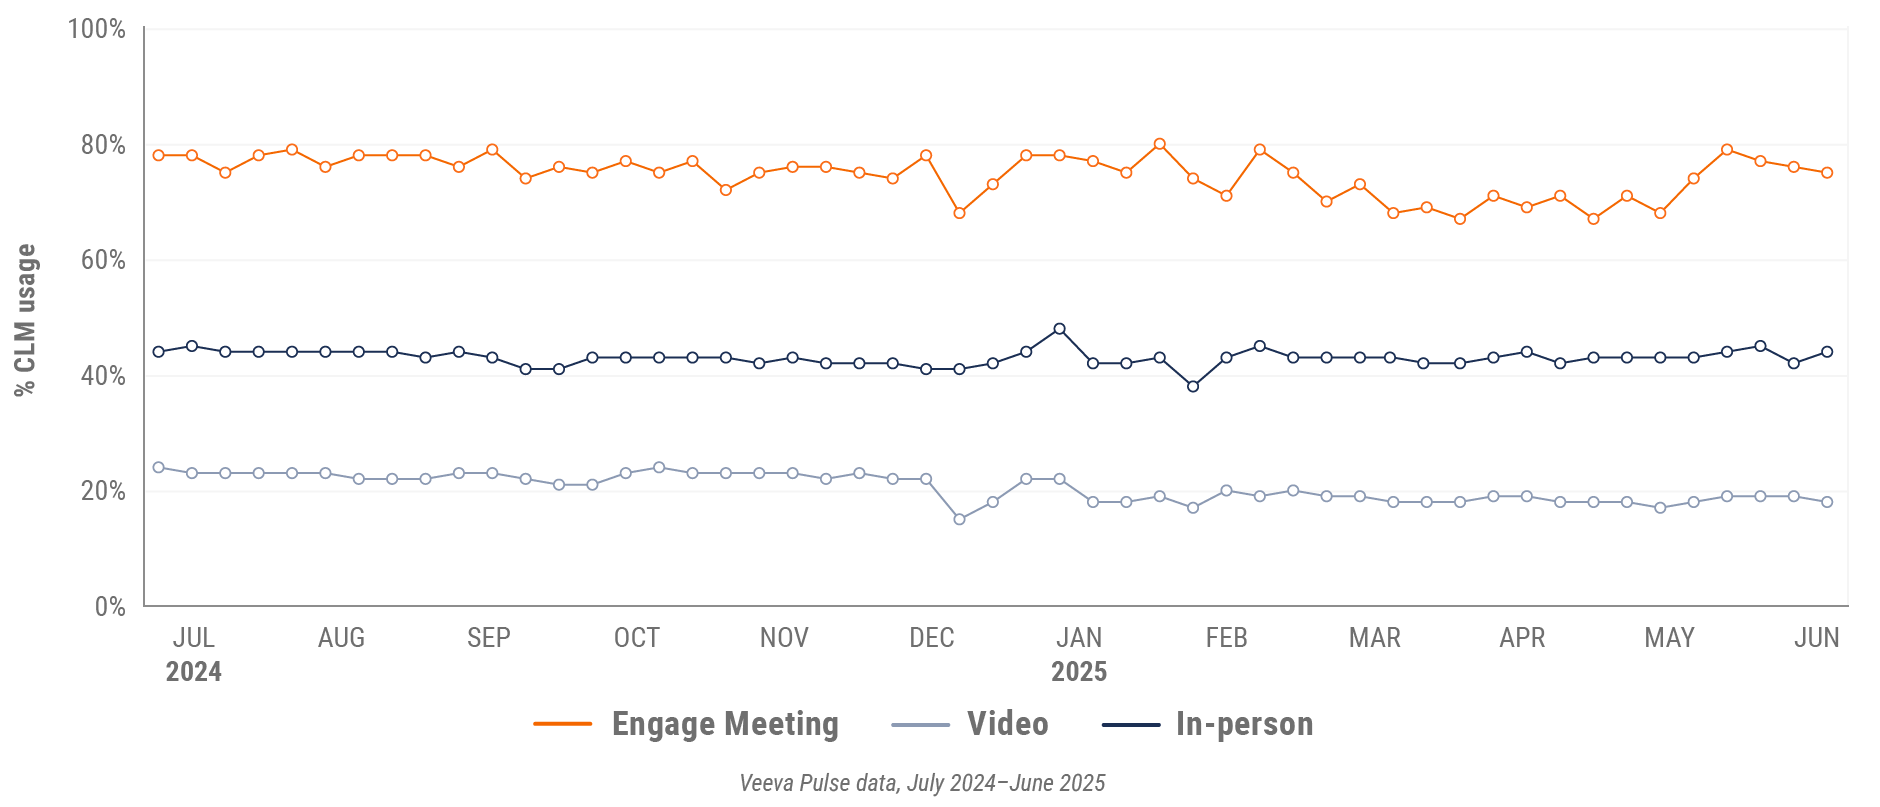
Figure 12: Veeva CRM Engage meeting duration, U.S.

Europe market trends
Figure 13: Channel mix evolution, Europe
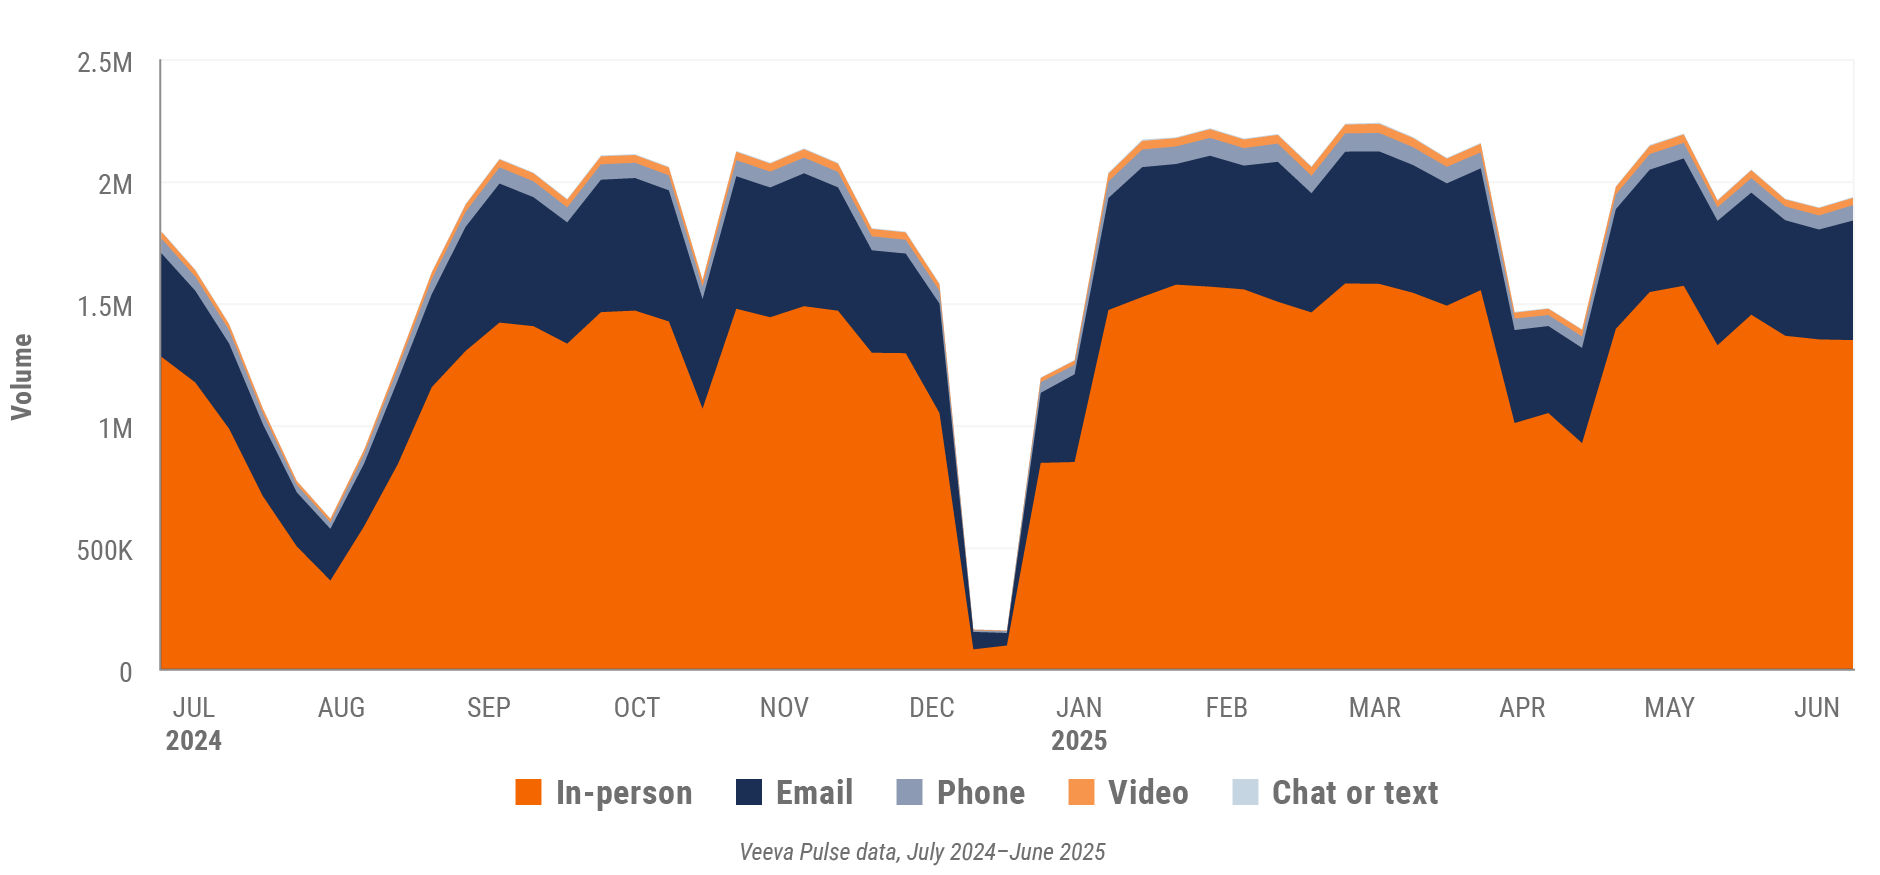
Figure 14: Channel mix, Europe

Europe field team activity
Weekly activity per user by engagement channel
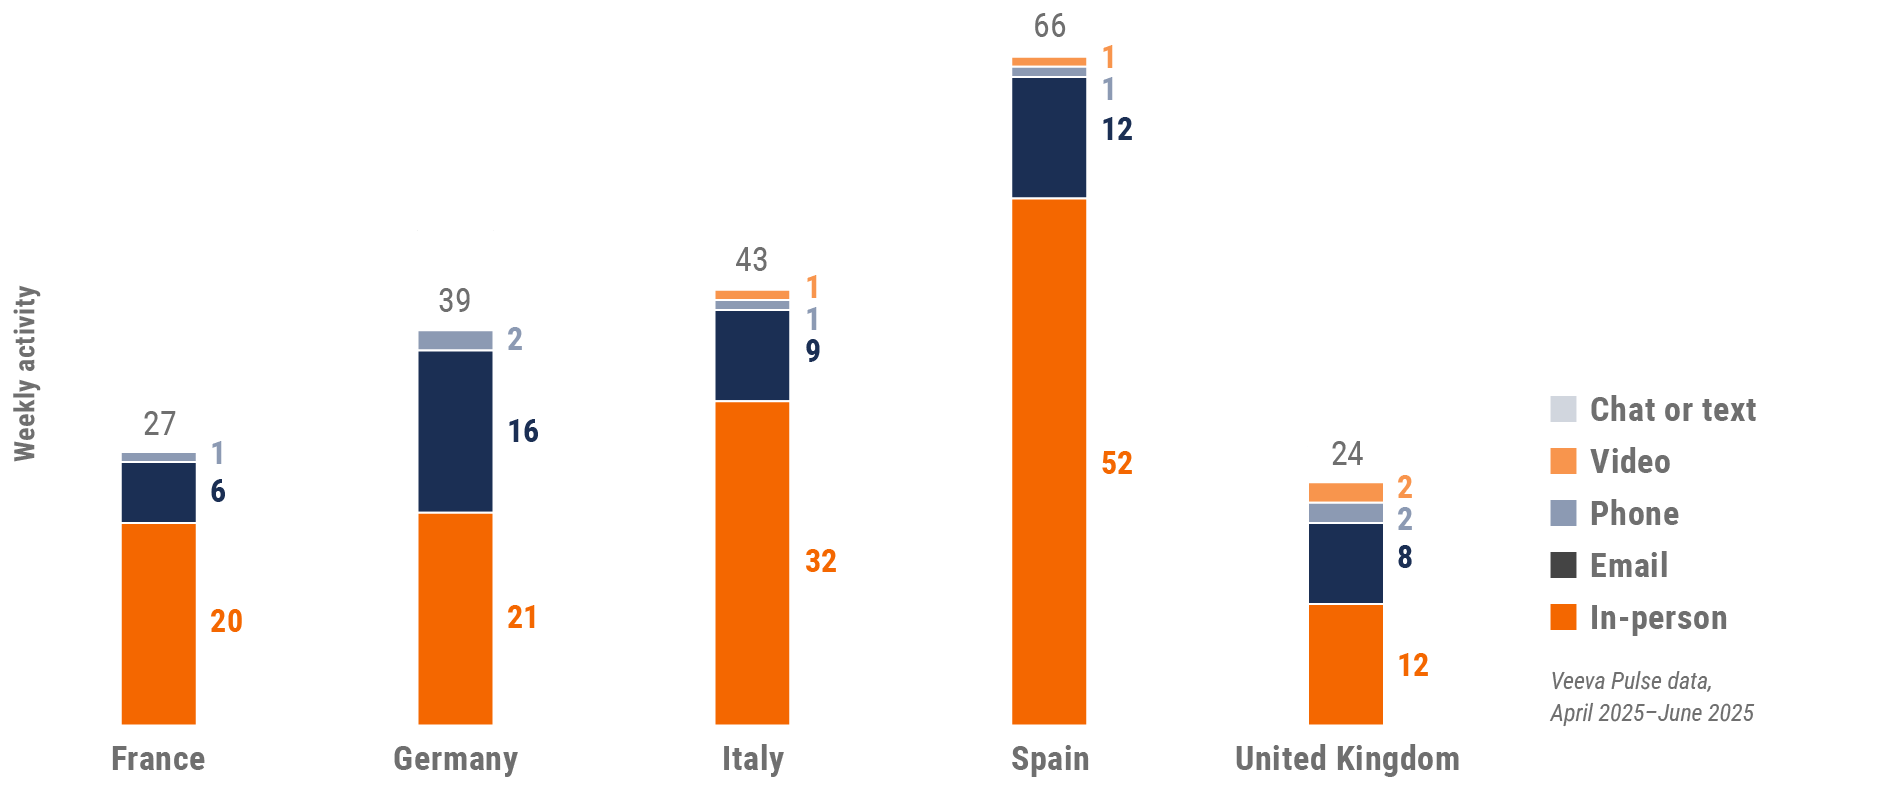
Figure 15: Activity by country, EU5
Europe engagement quality
Consolidation of key quality metrics
Figure 16: Approved email volume, Europe
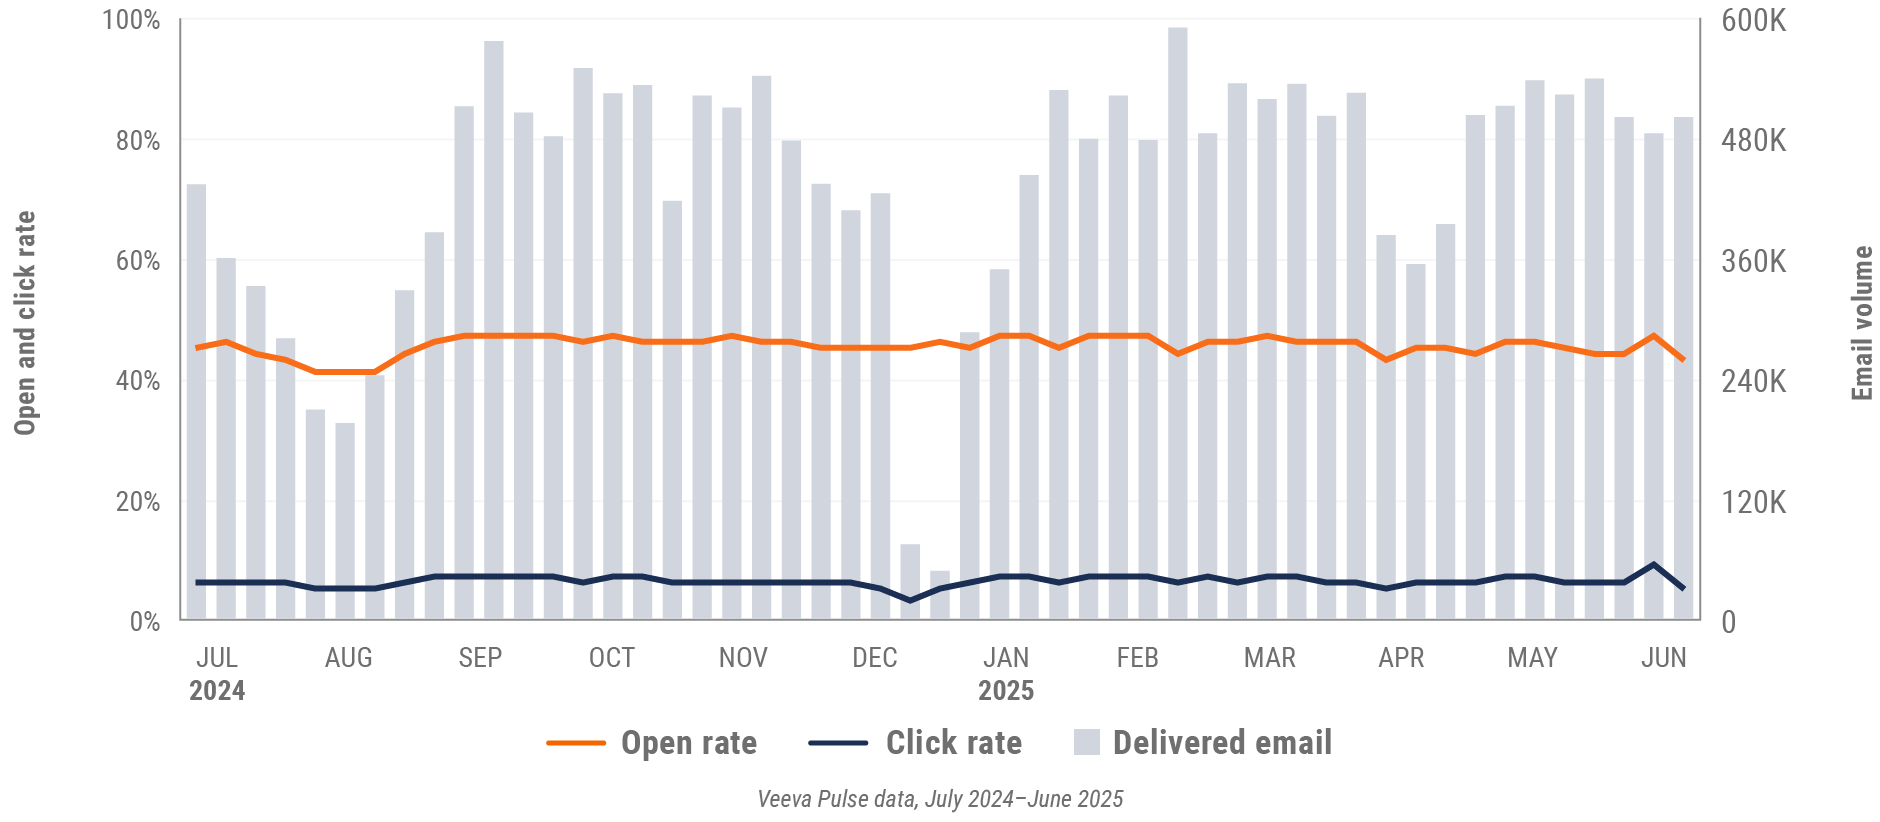
Figure 17: Content usage by channel, Europe
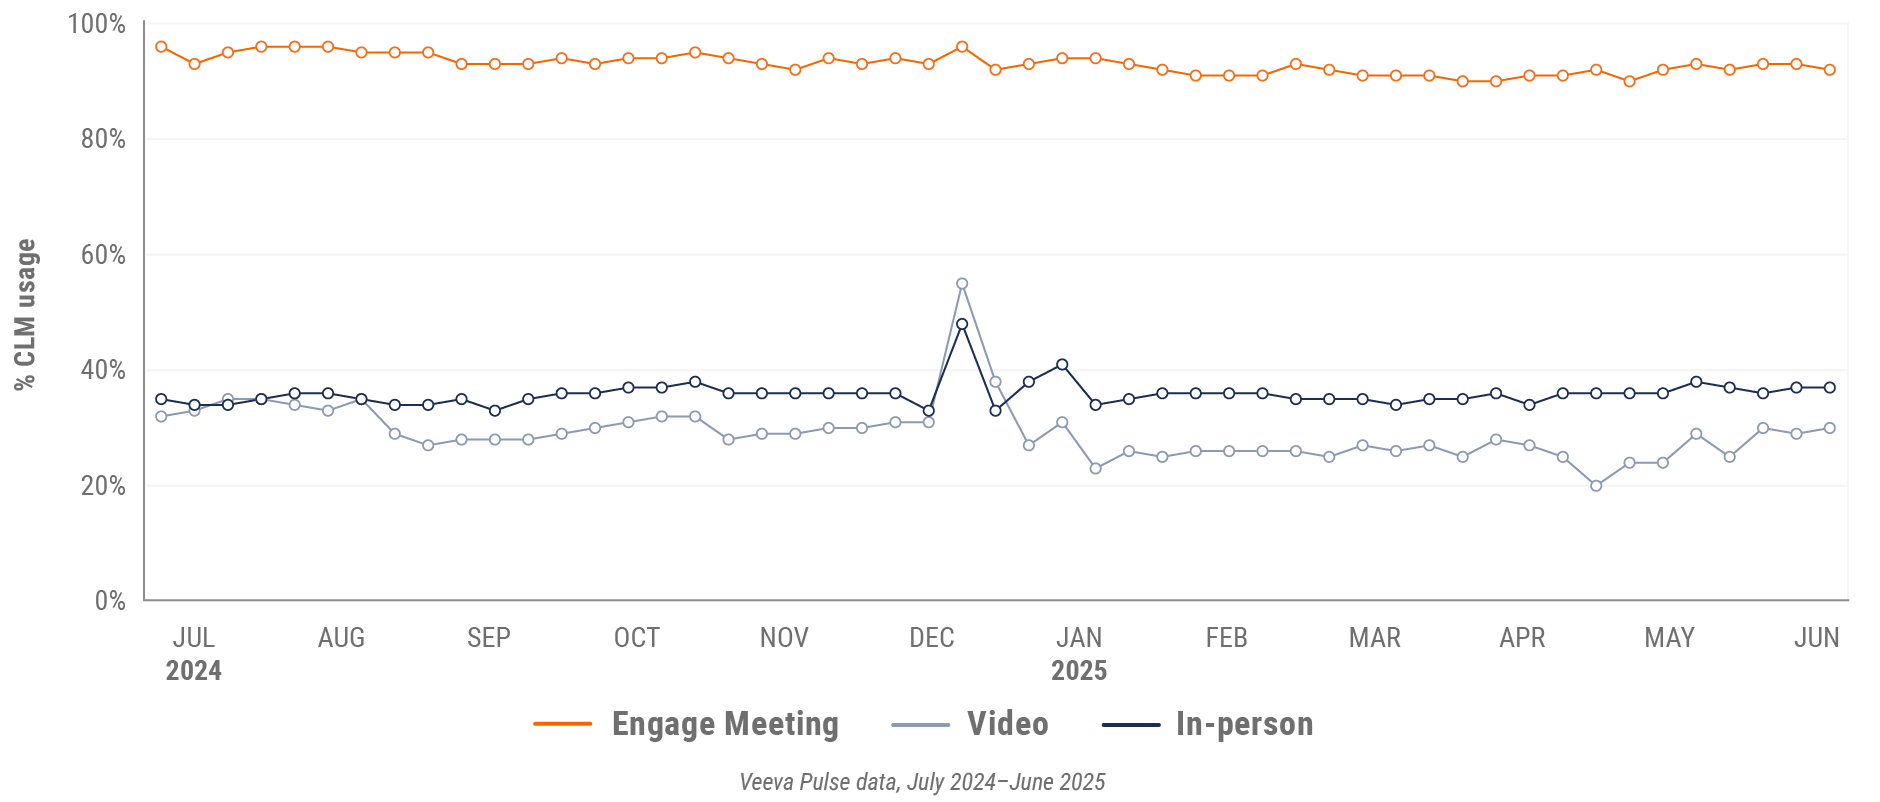
Figure 18: Veeva CRM Engage meeting duration, Europe

Asia market trends
Figure 19: Channel mix evolution, Asia
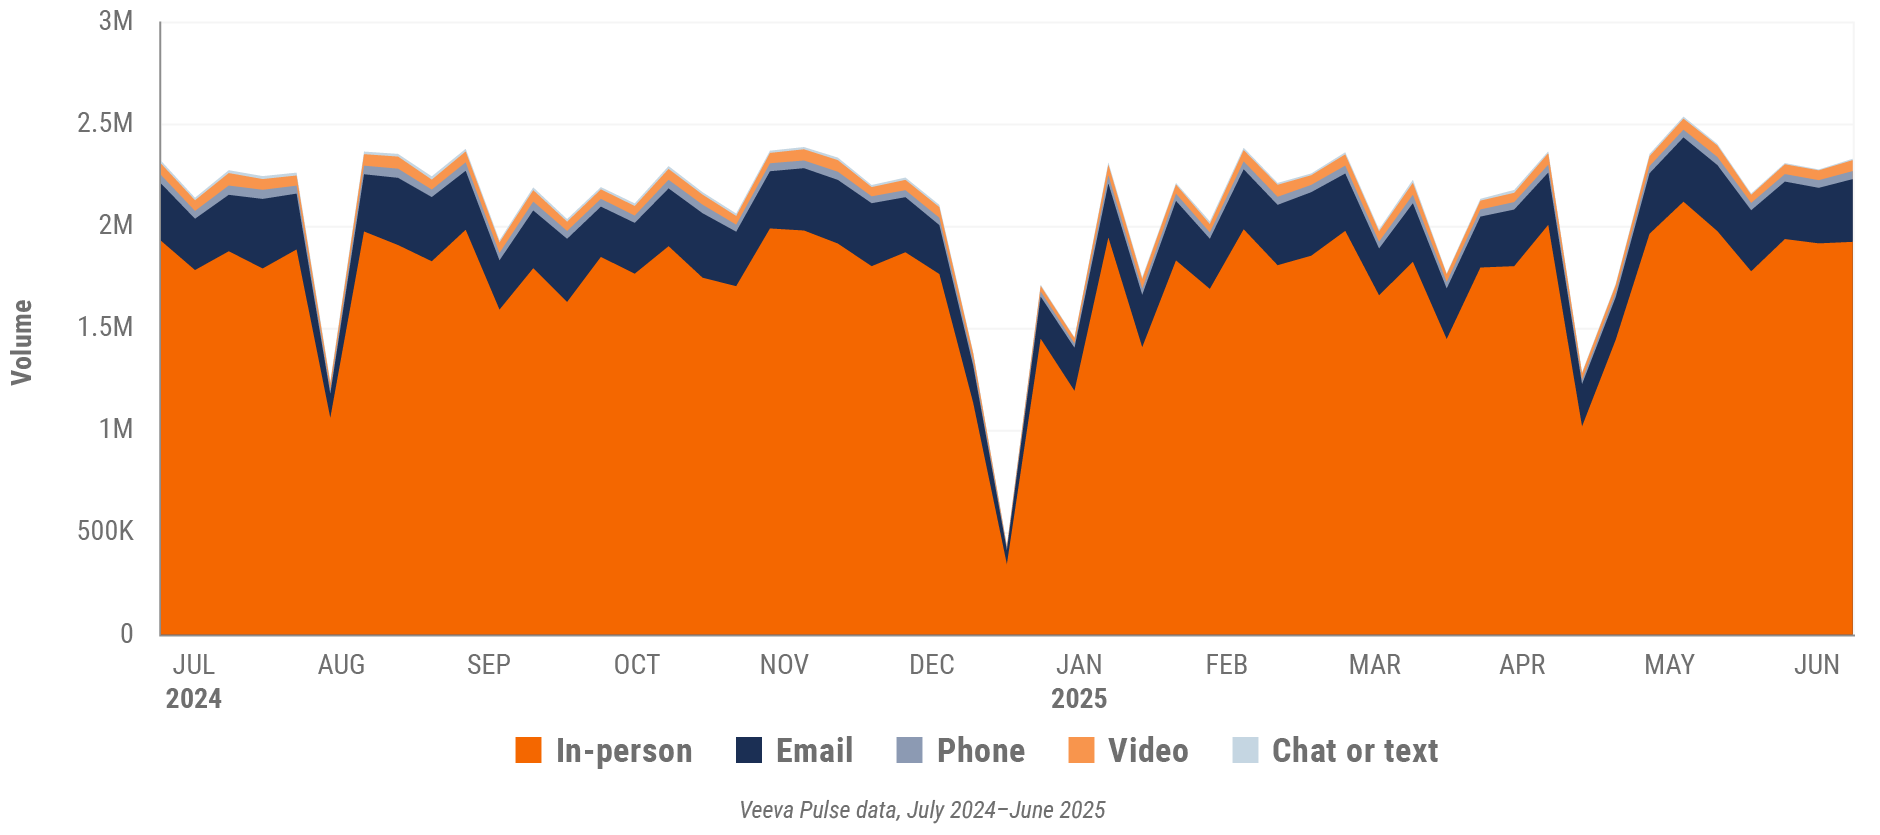
Figure 20: Channel mix, Asia

Asia field team activity
Weekly activity per user by engagement channel
Figure 21: Activity by country, Asia
Asia engagement quality
Consolidation of key quality metrics
Figure 22: Approved email volume, Asia
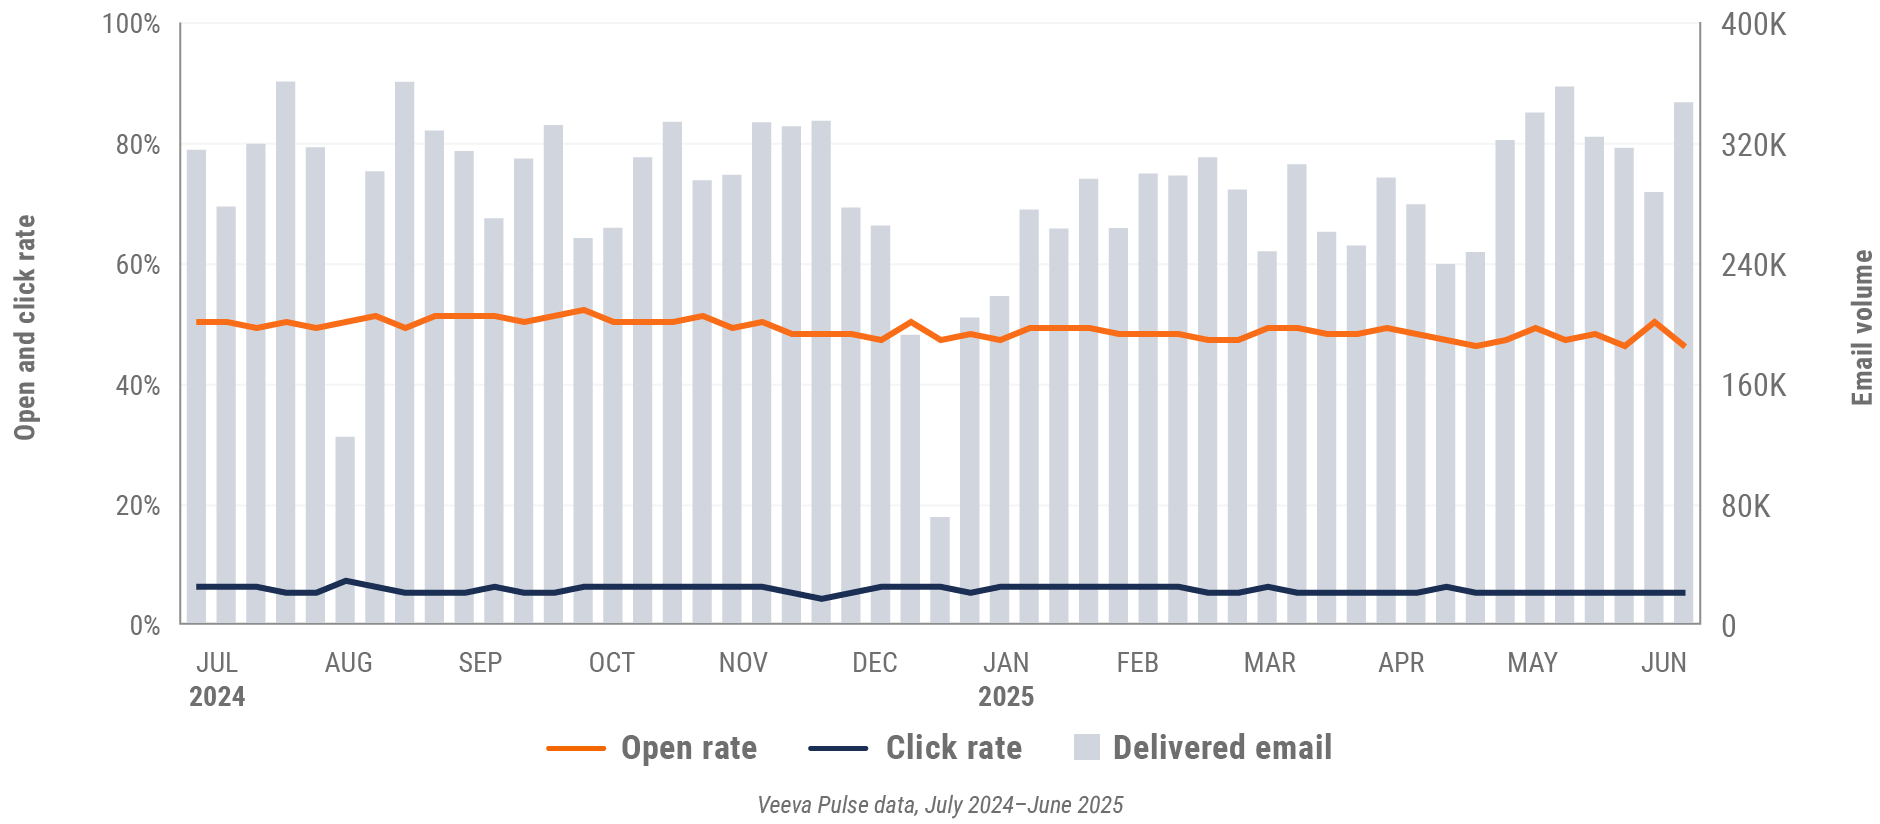
Figure 23: Content usage by channel, Asia
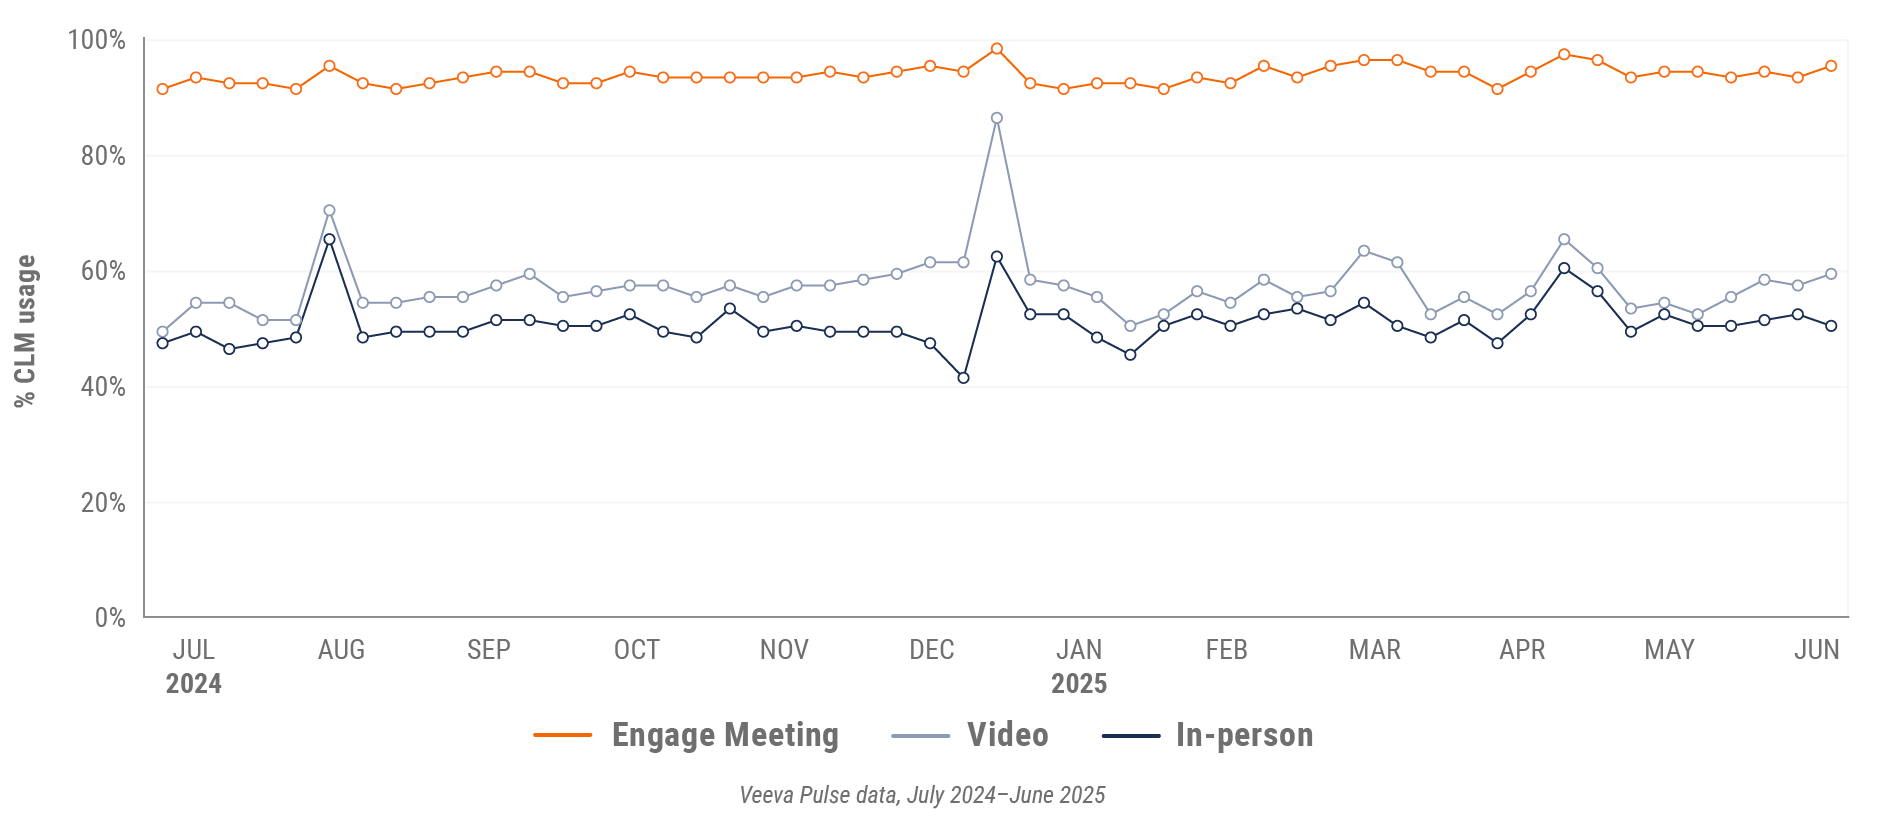
Figure 24: Veeva CRM Engage meeting duration, Asia

Latin America market trends
Figure 25: Channel mix evolution, Latin America
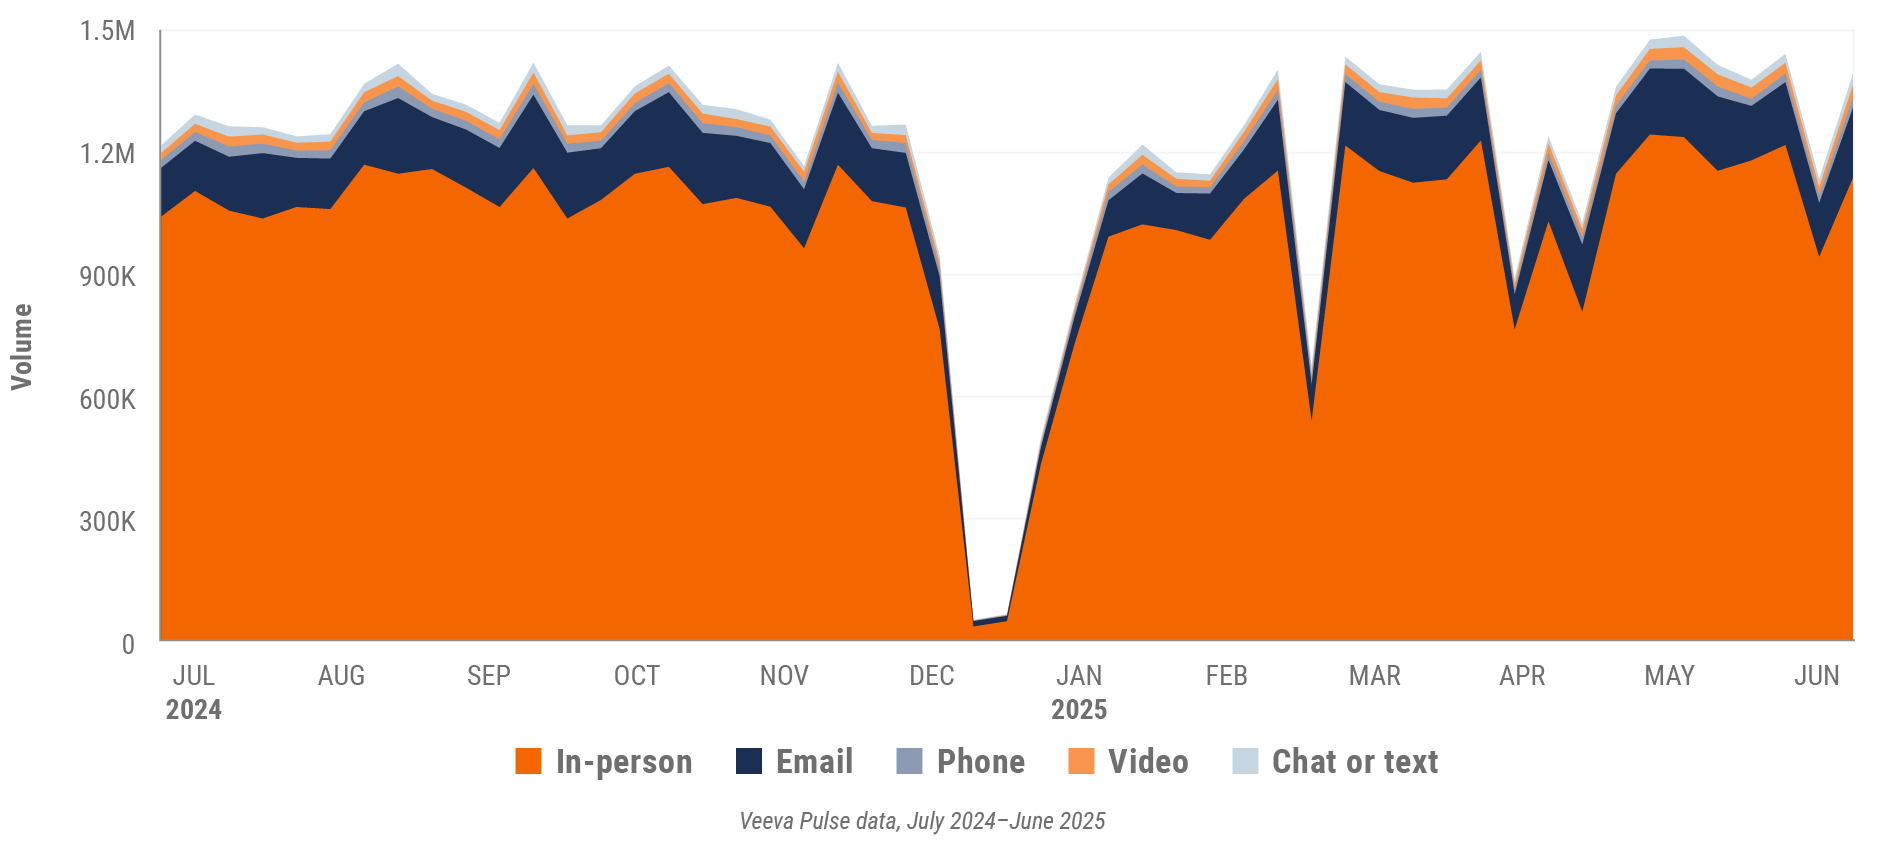
Figure 26: Channel mix, Latin America

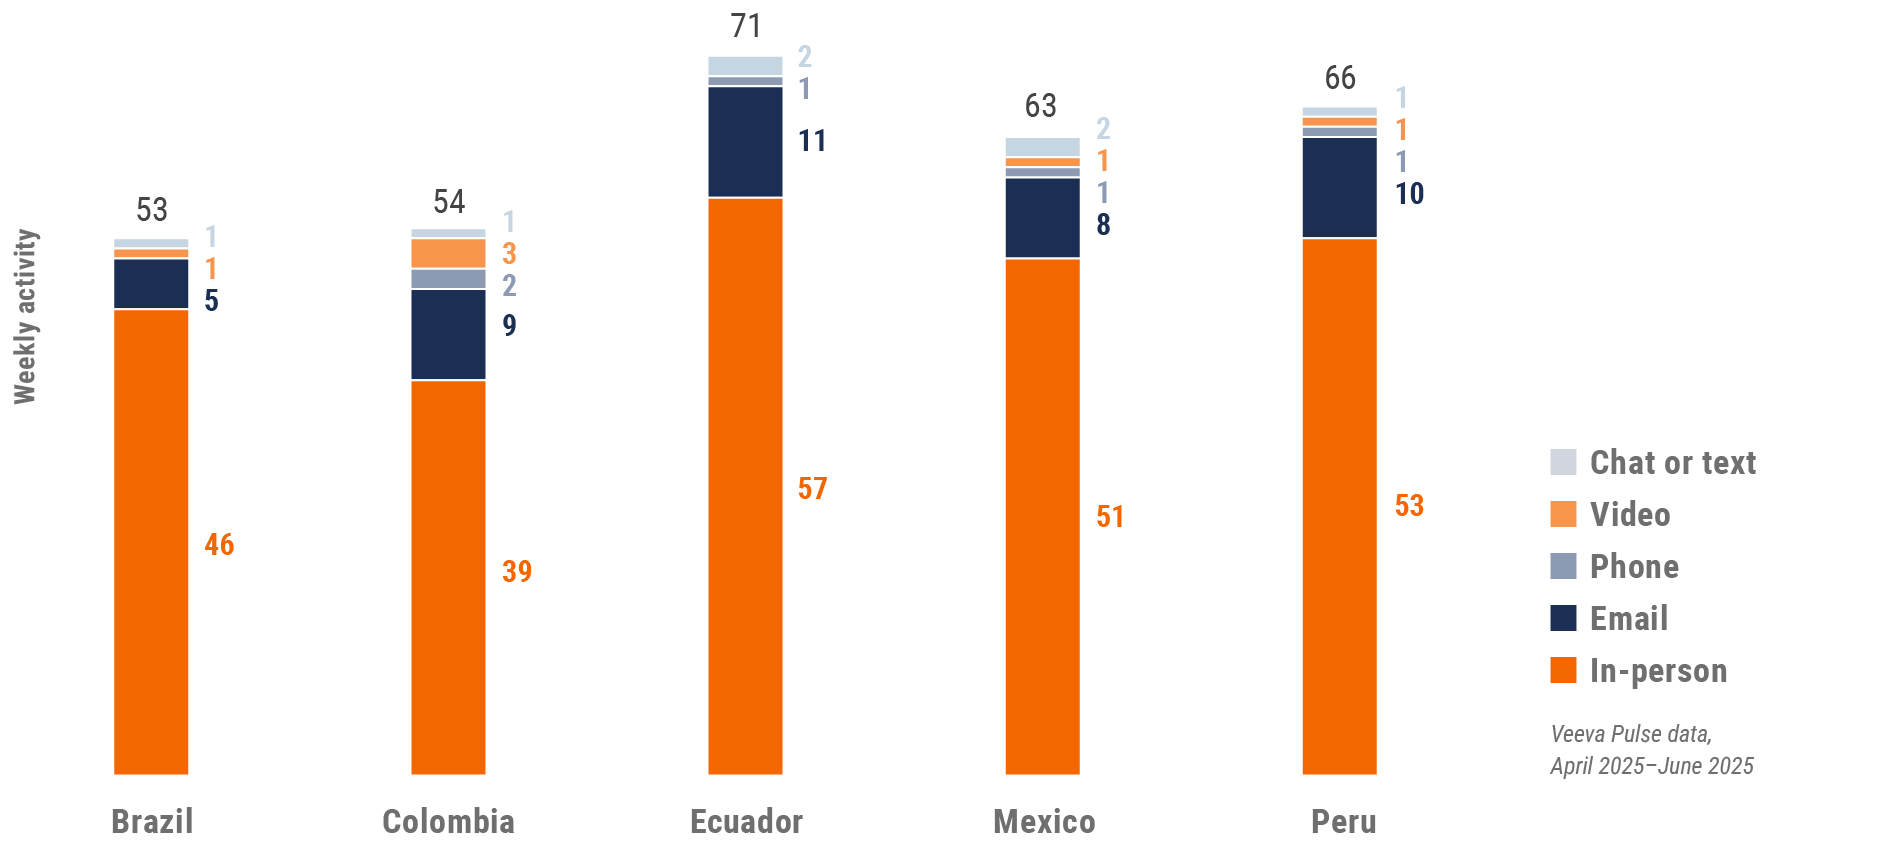
Latin America field team activity
Weekly activity per user by engagement channel
Figure 27: Activity by country, Latin America
Latin America engagement quality
Consolidation of key quality metrics
Figure 28: Approved email volume, Latin America
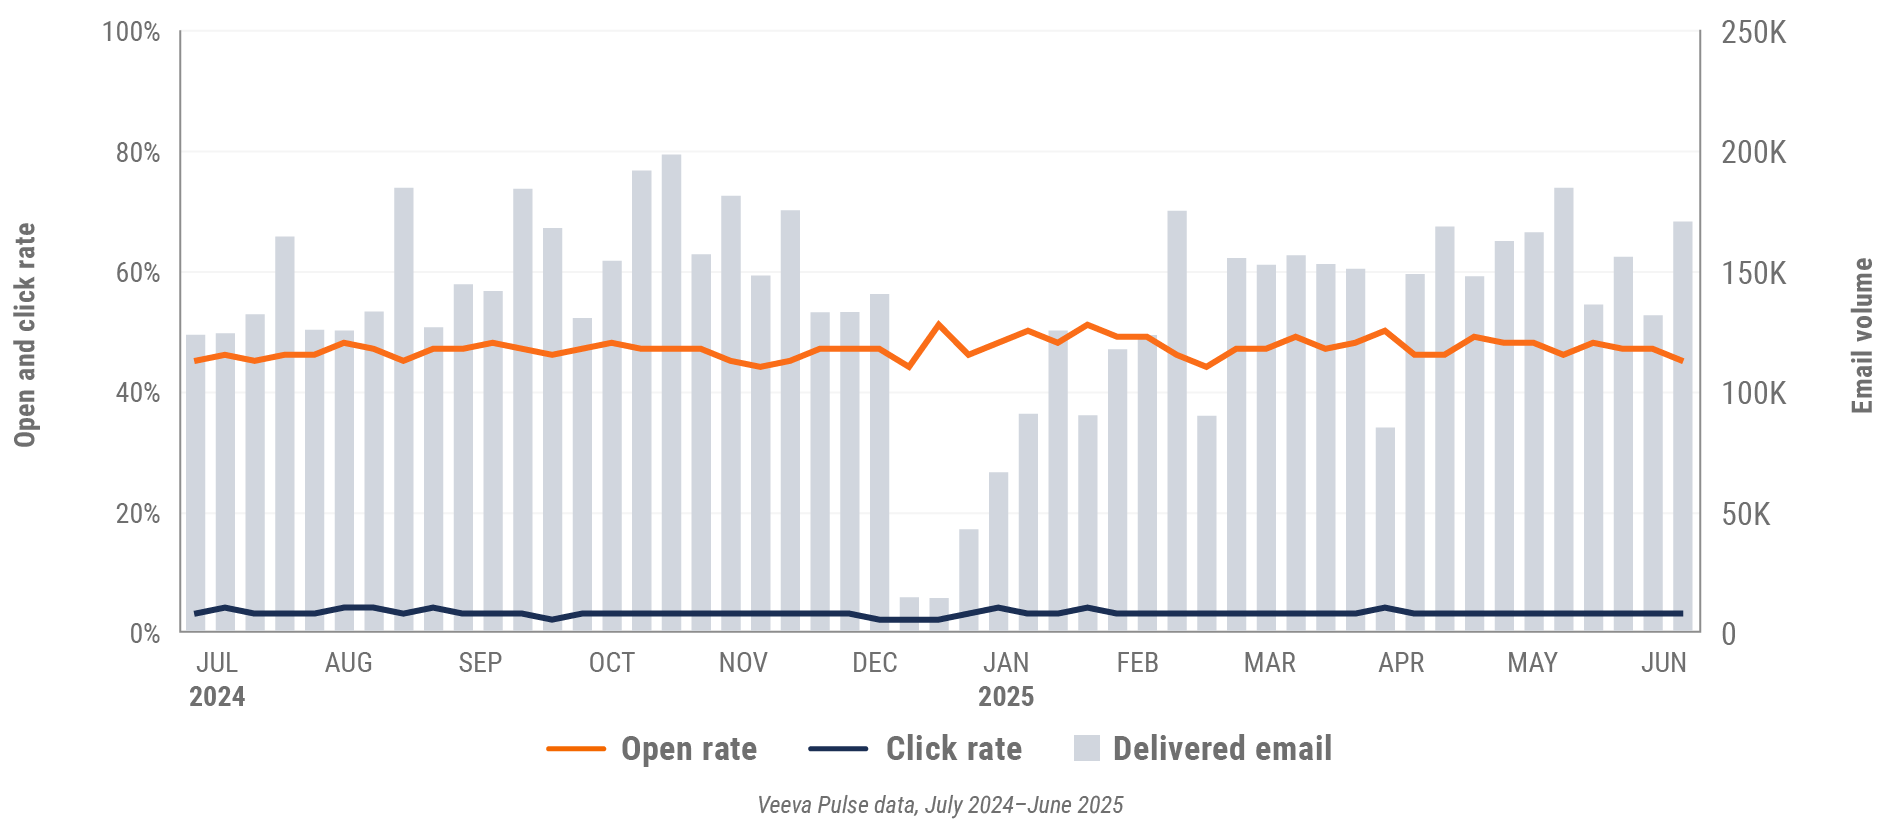
Figure 29: Content usage by channel, Latin America
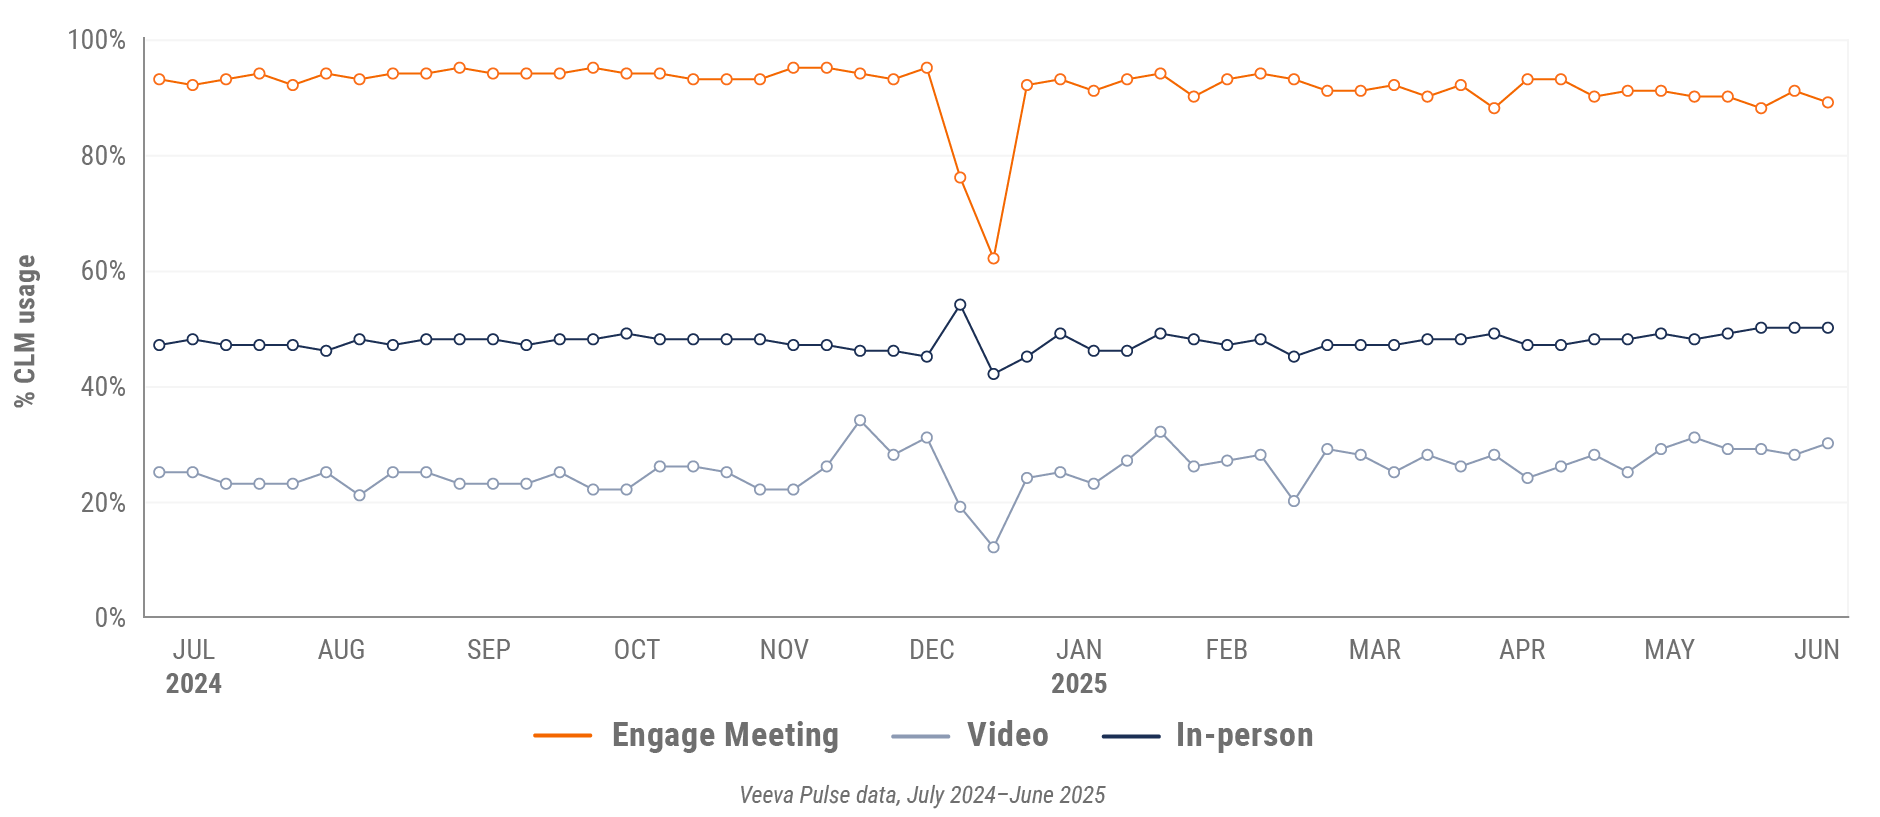
Figure 30: Veeva CRM Engage meeting duration, Latin America

Appendix: Data dictionary
Metric definitions
- Channel mix evolution over time: Weekly Veeva CRM activity volume broken down by the channel of engagement (in-person, phone, video, email, chat or text)
- Channel mix: Total Veeva CRM activity volume broken out by engagement channel percentage, calculated using percent change during the specified period
- Weekly activities per user: The average weekly number of Veeva CRM activities submitted per number of users active in Veeva CRM
- Approved email volume: The average weekly volume of approved emails sent via Veeva CRM, calculated using percent change during the specified period
- Email open rate: Percentage of approved emails opened at least once out of all approved emails sent via Veeva CRM
- Email click rate: Percentage of approved emails clicked at least once out of all approved emails sent via Veeva CRM
- In-person % CLM usage: Percentage of in-person engagements that leveraged content in Veeva CRM
- Video % CLM usage: Percentage of video engagements that leveraged content in Veeva CRM
- Veeva CRM Engage meeting % CLM usage: Percentage of Veeva CRM Engage meetings that leveraged content in Veeva CRM
- Veeva CRM Engage meeting duration: The average duration of Veeva CRM Engage meetings in minutes
Engagement channel definitions
- In-person: Submitted calls with a CRM Standard Metrics call channel value of ‘in-person’
- Phone: Submitted calls with a CRM Standard Metrics call channel value of ‘phone’
- Video: Veeva CRM Engage calls and video calls via other platforms that are then recorded as calls in Veeva CRM with a Standard Metrics call channel value of ‘video’
- Email: Approved emails and emails sent via other platforms that are then recorded as calls in Veeva CRM with a Standard Metrics call channel value of ‘email’
- Chat or text: Submitted calls with a CRM Standard Metrics call channel value of ‘chat or text’
Region definitions
- Global: All markets globally except China
- Europe: Albania, Andorra, Armenia, Aruba, Austria, Azerbaijan, Belarus, Belgium, Bermuda, Bosnia and Herzegovina,
Bulgaria, Croatia, Cyprus, Czech Republic, Denmark, Estonia, Finland, France, French Polynesia, Georgia, Germany,
Greece, Greenland, Guadeloupe, Guernsey, Hungary, Ireland, Italy, Jersey, Latvia, Lithuania, Luxembourg, Macedonia,
Malta, Martinique, Republic of Moldova, Monaco, Montenegro, Netherlands, New Caledonia, Norway, Poland, Portugal,
Romania, Serbia, Slovakia, Slovenia, Spain, Sweden, Switzerland, Ukraine, United Kingdom - Asia: Australia, Bangladesh, Bhutan, Brunei Darussalam, Cambodia, Cocos (Keeling) Islands, Indonesia, Japan,
Kazakhstan, Republic of Korea, Kyrgyzstan, Malaysia, Mongolia, Myanmar, Nauru, Nepal, New Zealand, Philippines,
Samoa, Singapore, Solomon Islands, Sri Lanka, Taiwan, Tajikistan, Thailand, Turkmenistan, Uzbekistan, Vietnam - Latin America: Antigua and Barbuda, Argentina, Bahamas, Barbados, Belize, Bolivia, Brazil, Chile, Colombia, Costa
Rica, Cuba, Dominican Republic, Ecuador, El Salvador, Guatemala, Guyana, Haiti, Honduras, Jamaica, Mexico,
Nicaragua, Panama, Paraguay, Peru, Trinidad and Tobago, Uruguay, Venezuela
Methodology
The Veeva Pulse Field Trends Report is a quarterly industry benchmark for global and regional healthcare
professional (HCP) engagement across the life sciences industry. The findings are based on:
- Approximately 600 million annual global field activities captured in Veeva CRM and Veeva CRM Engage.
- Marketing effectiveness data from Veeva Crossix. Crossix connects anonymized health data on 300+ million patients to media data to measure the impact of direct-to-consumer and HCP marketing investments in the U.S.
- Anonymous patient longitudinal claims data from Veeva Compass Patient covering dispensed prescriptions, procedures, and diagnoses from 300+ million patients.
- 4+ million profiles containing publications, clinical trials, conferences, associations, guidelines, grants, payments, social media, news mentions, and patient mix by disease and drug class from Veeva Link Key People in 85+ countries and all major therapeutic areas.
- Global reference data of HCPs, healthcare organizations, and affiliations from Veeva OpenData, containing addresses, emails, specialties, demographics, and compliance data (license information and industry identifiers) in 100+ countries.
The Veeva Pulse Field Trends Report delivers insights that inform the industry and help field teams align their
strategy to key market trends for improved commercial success. The global Veeva Business Consulting team also
helps customers inform their strategies using industry benchmarking with Veeva Pulse data.
