Industry Report
Veeva Pulse Field Trends Report
Pre-Launch Field Medical Education Leads to 1.5x Increase in Treatment Adoption
70% of KOLs engage with only one biopharma, as traditional planning misses most experts
For the first time, the biopharma industry has clear data demonstrating the impact of field medical on clinical practice in a launch setting. A new analysis of migraine products shows that disease state education by field medical with key opinion leaders (KOLs) before launch is associated with 1.5 times greater treatment adoption1 across that healthcare organization (HCO) over the first six months post-launch.
Despite this clear connection between scientific engagement and treatment adoption, new data also shows most KOLs are underserved by field medical. Veeva Pulse data reveals that 70% of KOLs engage with only one biopharma, severely limiting scientific exchange, medical insights, and potential treatment adoption.
The industry lacks a standard, data-driven approach to identifying, prioritizing, and engaging KOLs. But companies like Lundbeck are combining real-time customer intelligence and CRM data to create a new engagement model.
“The right data is foundational to our engagement strategy. As we prepared for the launch of new treatments, this data- driven approach helped us build the right relationships and focus our resources where they will have the greatest scientific impact,” said Christine Castro, director, medical affairs excellence at Lundbeck.
Ensure your field medical team is creating the impact that matters most with Veeva Business Consulting’s in-depth analysis.
Thank you,

Dan Rizzo
Global Head of Veeva Business Consulting
Field Medical Has a Significant Impact on Launch Success
Medical science liaison (MSL) engagement with KOLs before product launch, either in person or via video, results in 1.5 times greater treatment adoption across the HCO within the first six months of launch, compared to HCOs whose KOLs were not engaged.2 This early education by MSLs has a lasting impact, as new treatment starts sustain at 1.3 times greater 18 to 24 months after product launch. These results show what biopharmas have long understood but were not able to accurately measure.
Despite this impact, Veeva Pulse data shows that investment in medical field force size over the last 12 months has remained flat. HCPs, meanwhile, are overwhelmingly asking for more interactions – 91% of HCPs say visits by medical science liaisons are very effective but underused by biopharma.
Despite Demand, 70% of KOLs Engage With Only One Biopharma
MSLs spend significant time with the KOLs they engage. But, while the depth of individual connections may be substantial, the breadth of KOL engagement is not. New Veeva Pulse and Veeva Link data shows that nearly 70% of KOLs only interact with one company’s field medical team.3
Further, 30% of global experts, as identified in Veeva Link Key People, have no recorded interaction with MSLs at all.4 Whether medical affairs teams miss KOLs in mapping exercises or fail to record interactions, the result is the same – measuring the impact and connecting it to other insights across the organization is impossible.
The way MSLs select KOLs during planning contributes to this problem:
- Selection methods can be highly biased, especially toward traditional experts
- Prioritization methods do not reflect true KOL influence
- Narrow feedback loops limit medical insights and engagement with a broader scientific audience
Identify and Prioritize High-Impact KOLs With Industry Data
Real-time, connected data can broaden access to the right scientific experts as well as generate and share insights across the organization quickly and effectively. By using a data-driven approach, MSLs at one top pharma company improved scientific engagement strategy with medical experts:
Data alone does little, however. The best strategy ingests new data about KOLs quickly, prioritizes engagement based on KOL influence, and drives medical insights back into the business.
Reach out to Veeva Business Consulting to find out how you can use Veeva Pulse data to identify the right KOLs and improve scientific engagement.
3, 4 U.S. Veeva Pulse, Veeva Link Key People data, April 2022–April 2023.
Global and Regional Trends
This report highlights global and regional field engagement trends from Veeva Pulse data between July 2022 and June 2023. Veeva Pulse data is sourced from Veeva’s aggregated CRM activity dataset, inclusive of field engagement stats from all instances of Veeva CRM globally. For the first time, this report also includes insights into global field medical trends.
Global field medical trends
Figure 1: Channel mix evolution, global field medical
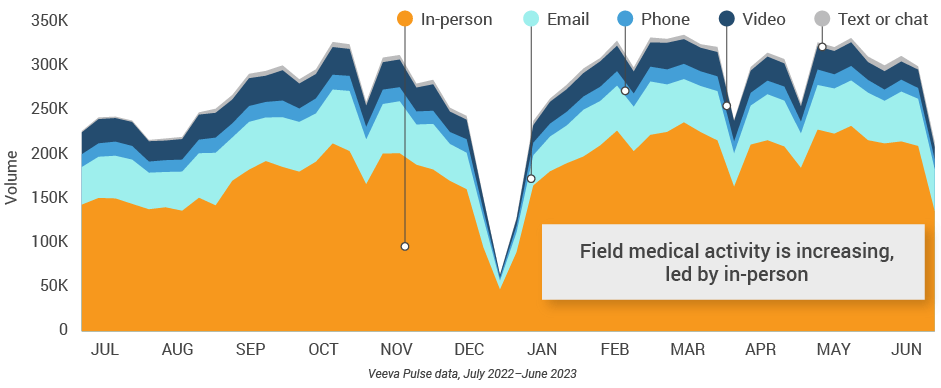
Figure 2: Channel mix, global field medical

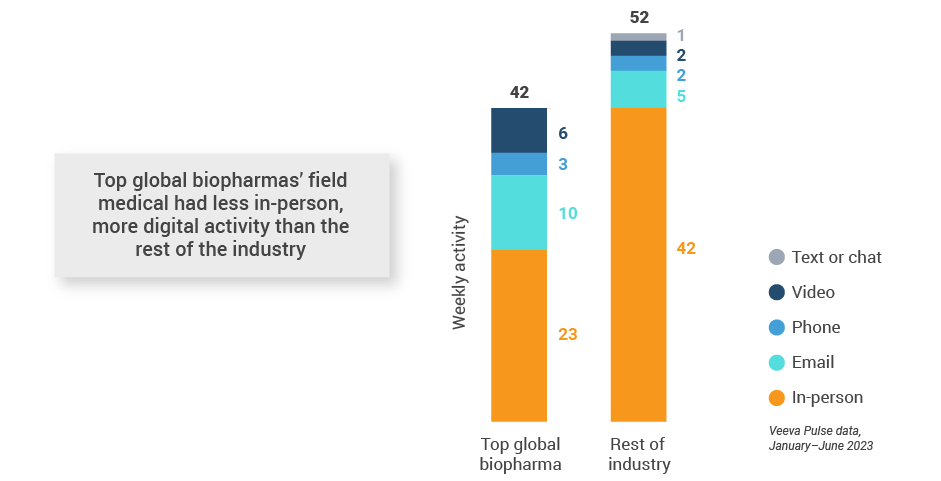
Global field medical activity Weekly activity per user by engagement channel
Figure 3: Activity by region, global field medical
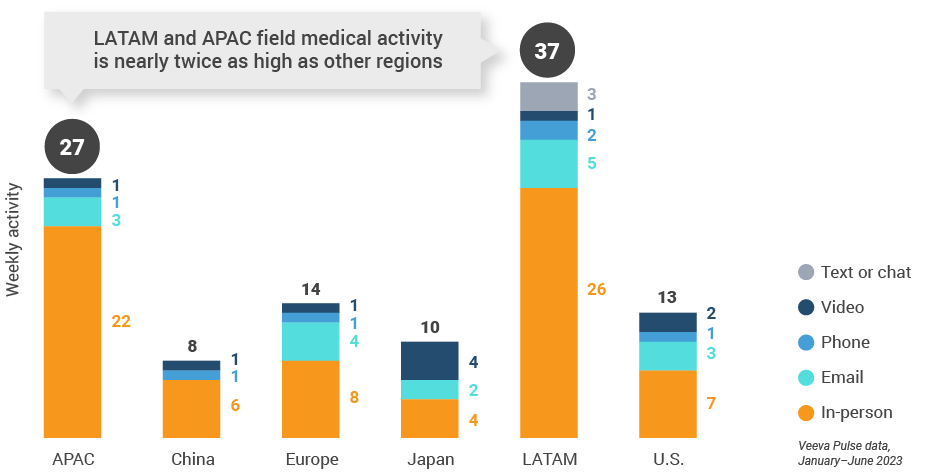
Figure 4: Activity by company size, global field medical
Global field medical engagement quality Consolidation of key quality metrics
Figure 5: Approved email volume, global field medical
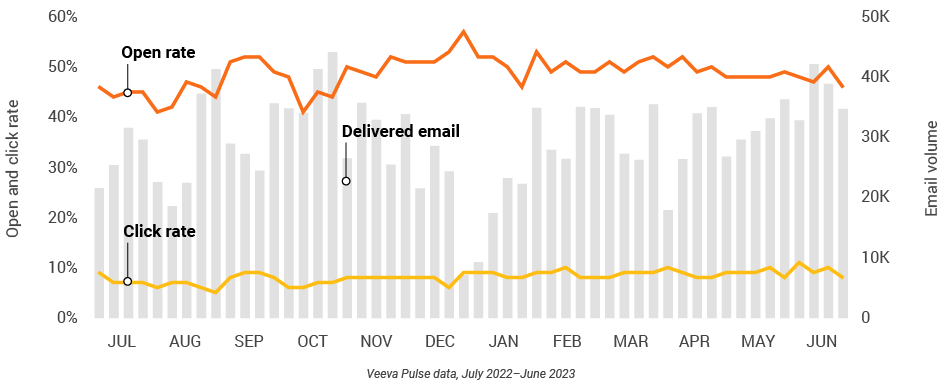
Figure 6: Content usage by channel, global field medical
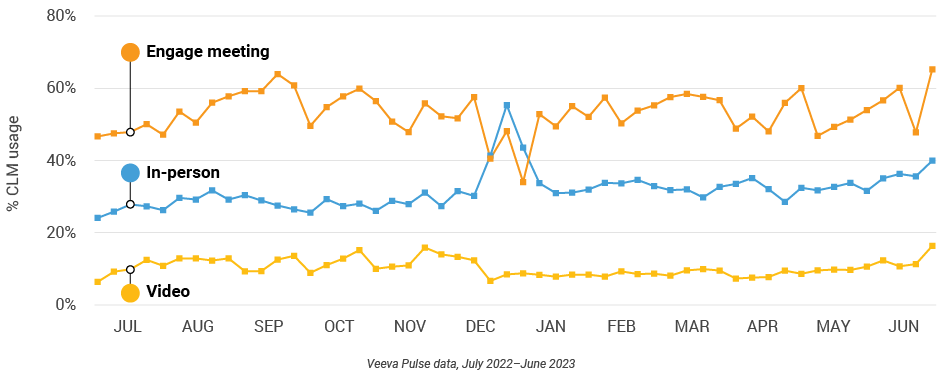
Figure 7: Veeva CRM Engage meeting duration, global field medical

Global trends: all field roles
Figure 8: Channel mix evolution, global
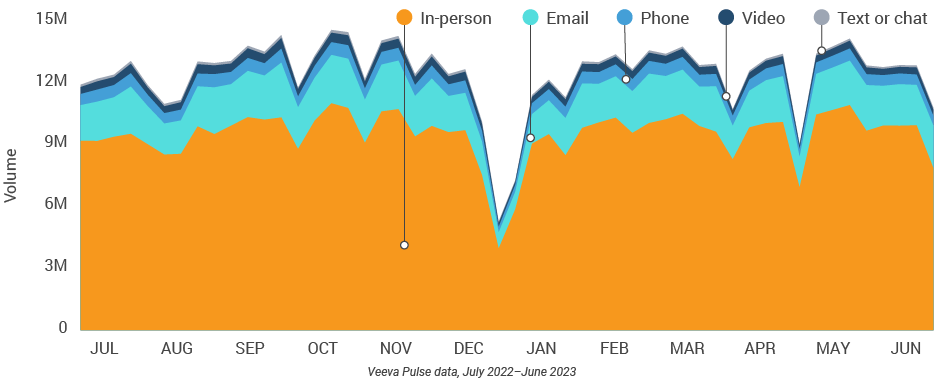
Figure 9: Channel mix, global

Global field team activity Weekly activity per user by engagement channel
Figure 10: Activity by region, global
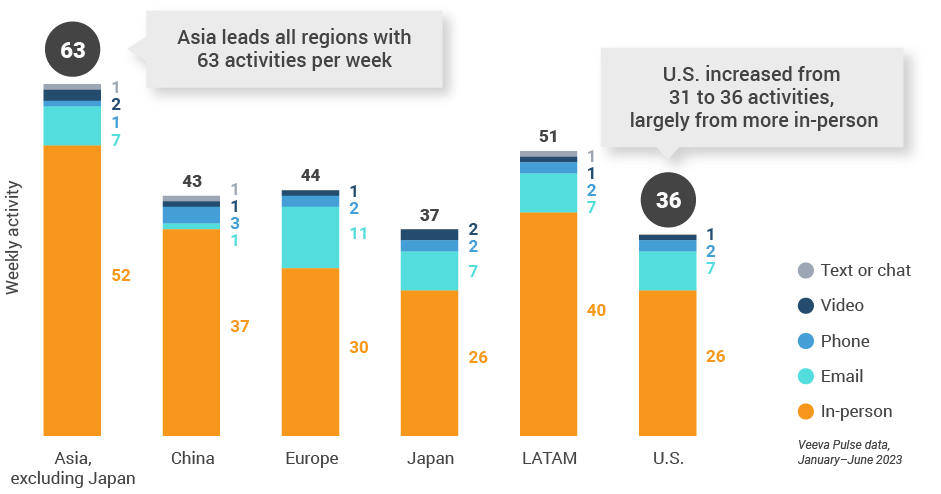
Figure 11: Activity by user type, global
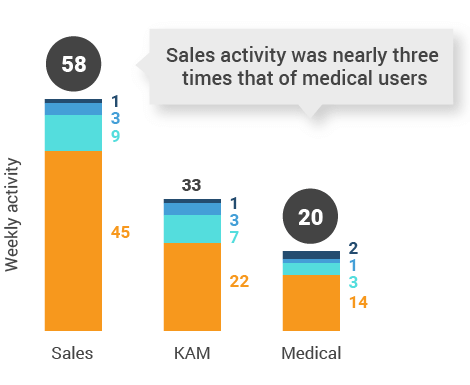
Figure 12: Activity by company size, global
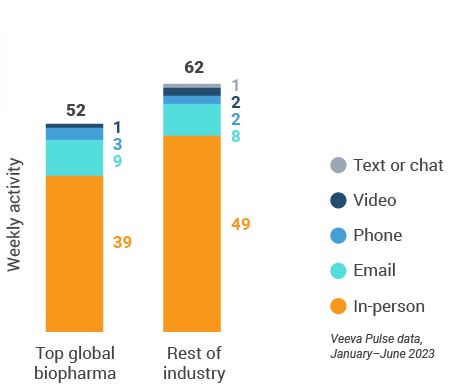
Global engagement quality Consolidation of key quality metrics
Figure 13: Approved email volume, global
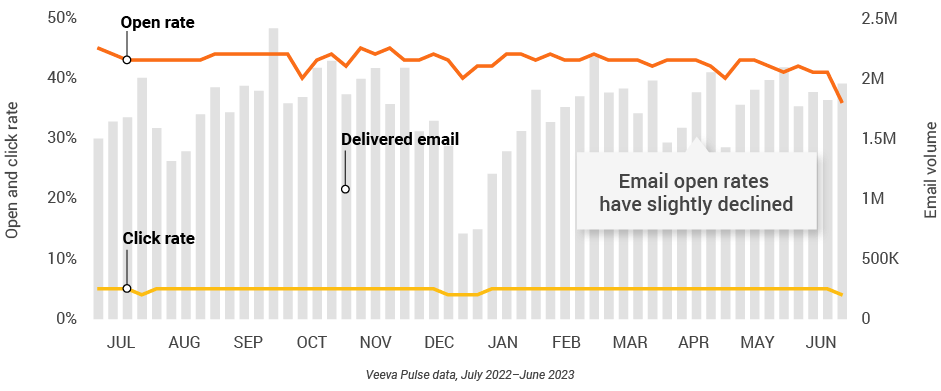
Figure 14: Content usage by channel, global
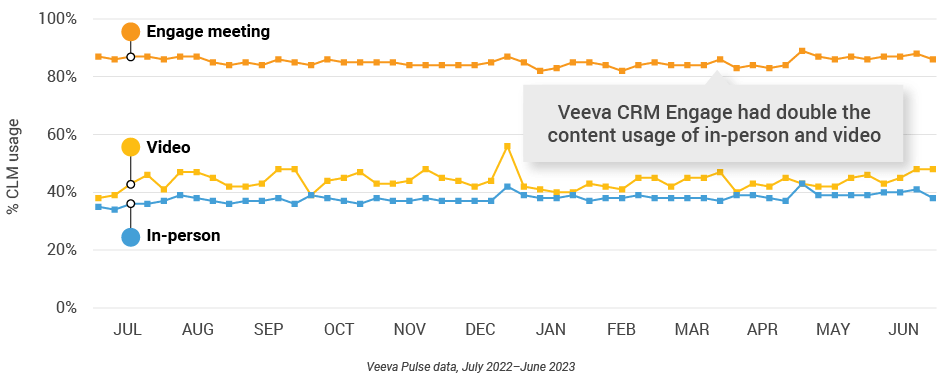
Figure 15: Veeva CRM Engage meeting duration, global

U.S. market trends
Figure 16: Channel mix evolution, U.S.
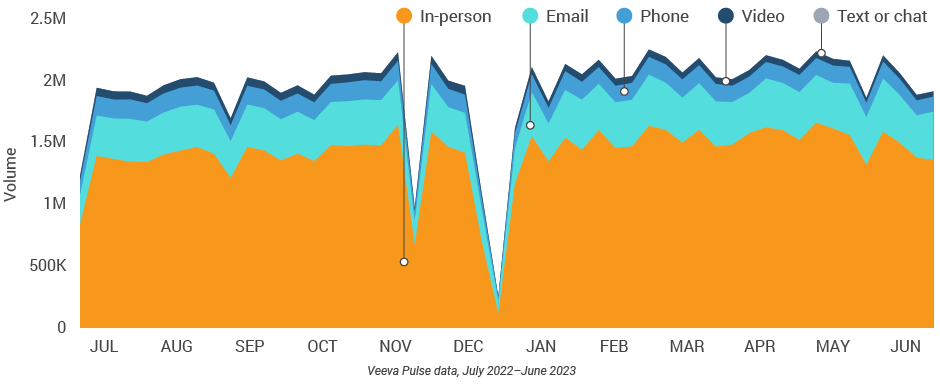
Figure 17: Channel mix, U.S.

U.S. field team activity Weekly activity per user by engagement channel
Figure 18: Activity, U.S.
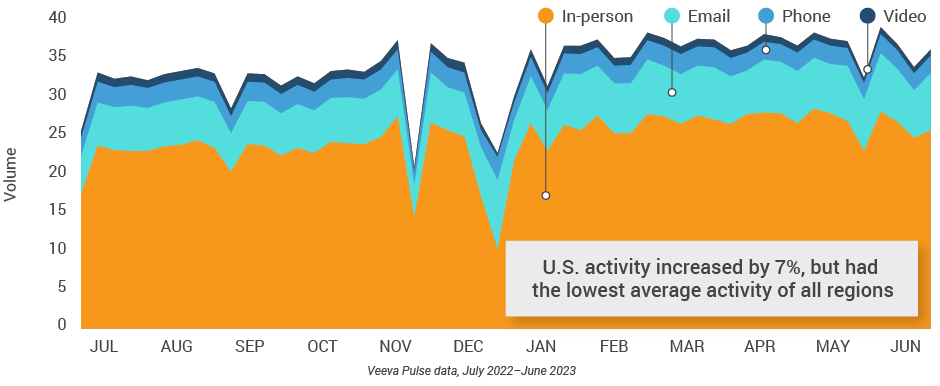
Figure 19: Activity by user type, U.S.
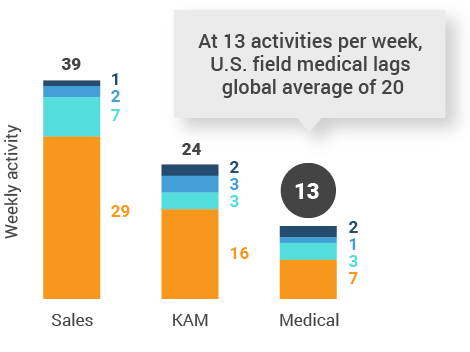
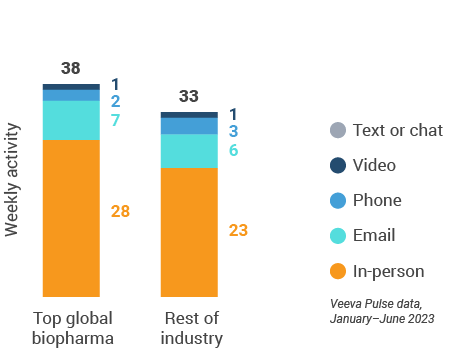
Figure 20: Activity by company size, U.S.
U.S. engagement quality Consolidation of key quality metrics
Figure 21: Approved email volume, U.S.
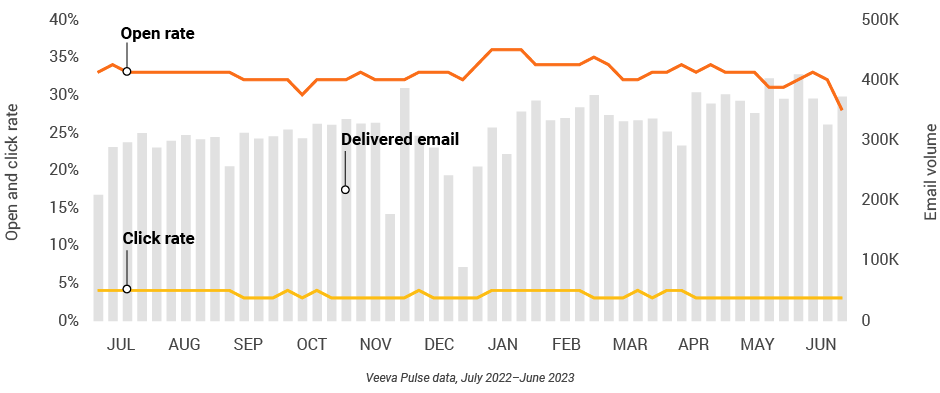
Figure 22: Content usage by channel, U.S.
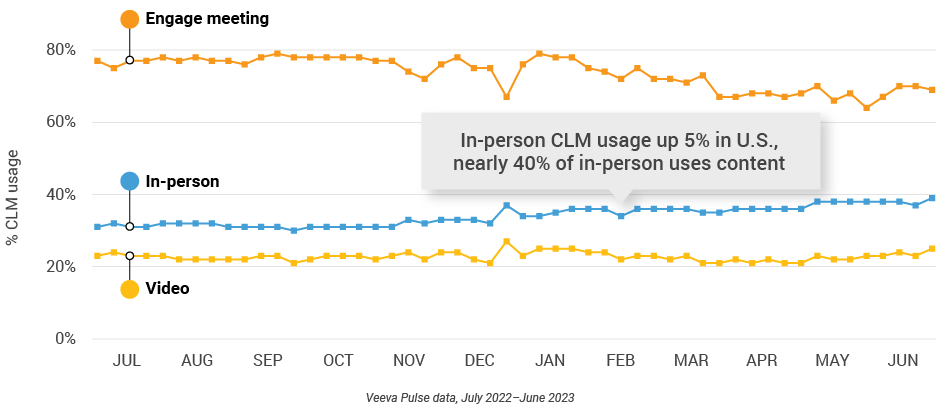
Figure 23: Veeva CRM Engage meeting duration, U.S.

Europe market trends
Figure 24: Channel mix evolution, Europe
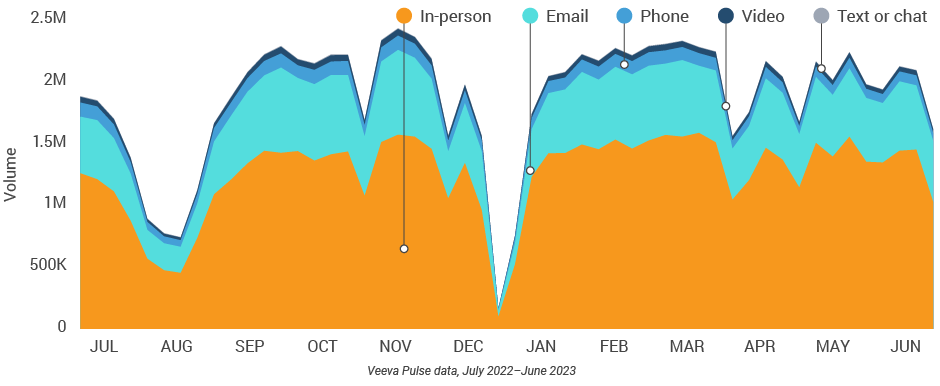
Figure 25: Channel mix, Europe

Europe field team activity Weekly activity per user by engagement channel
Figure 26: Activity by country, EU5
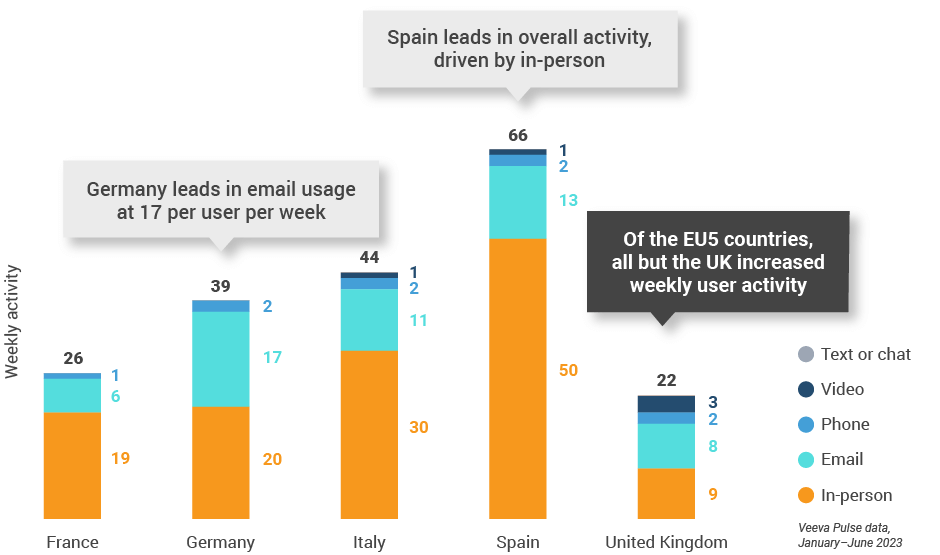
Figure 27: Activity by user type, Europe
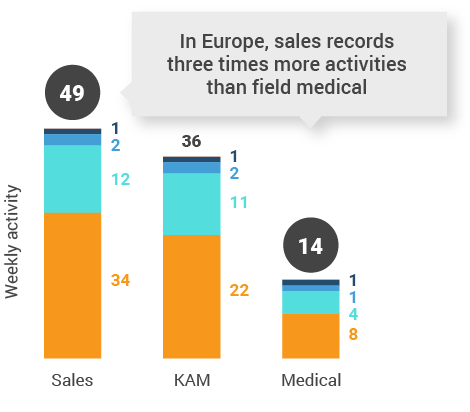
Figure 28: Activity by company size, Europe
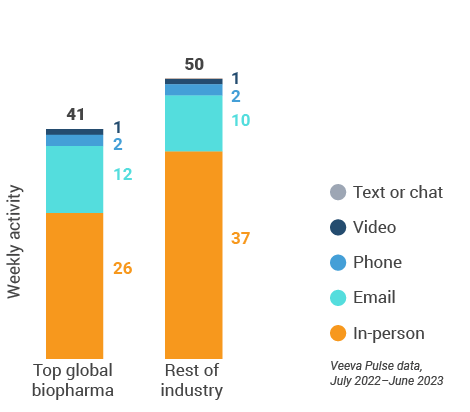
Europe engagement quality Consolidation of key quality metrics
Figure 29: Approved email volume, Europe
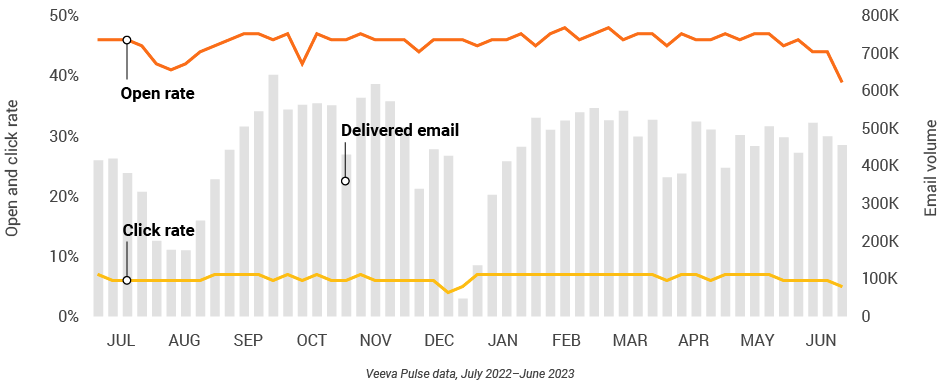
Figure 30: Content usage by channel, Europe
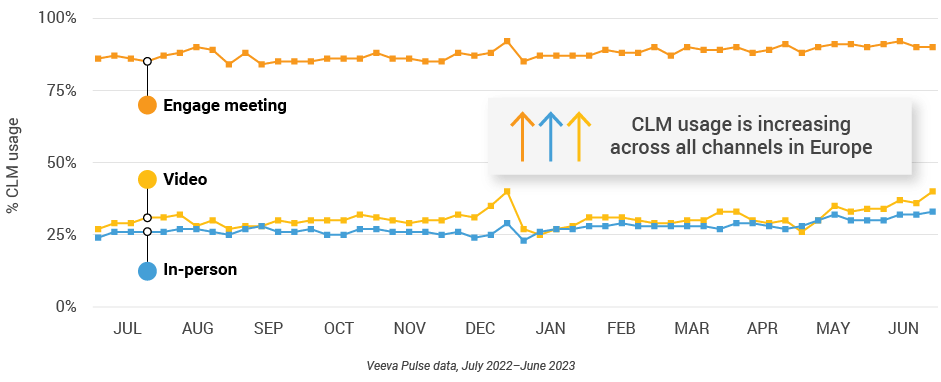
Figure 31: Veeva CRM Engage meeting duration, Europe

Asia market trends
Figure 32: Channel mix evolution, Asia
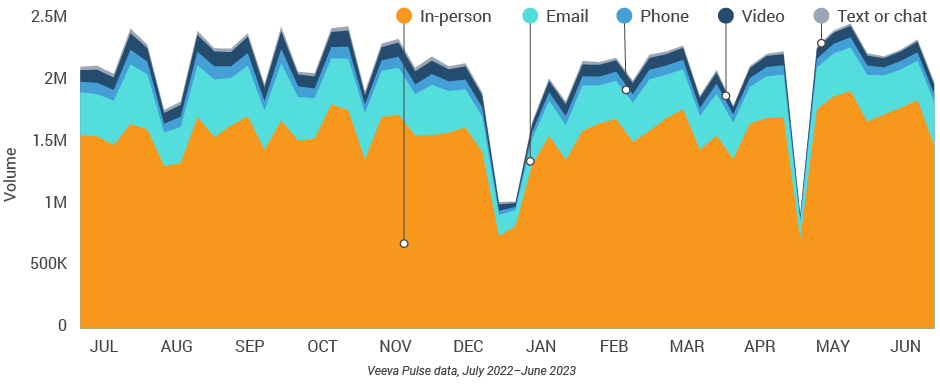
Figure 33: Channel mix, Asia

Asia field team activity Weekly activity per user by engagement channel
Figure 34: Activity by country, Asia
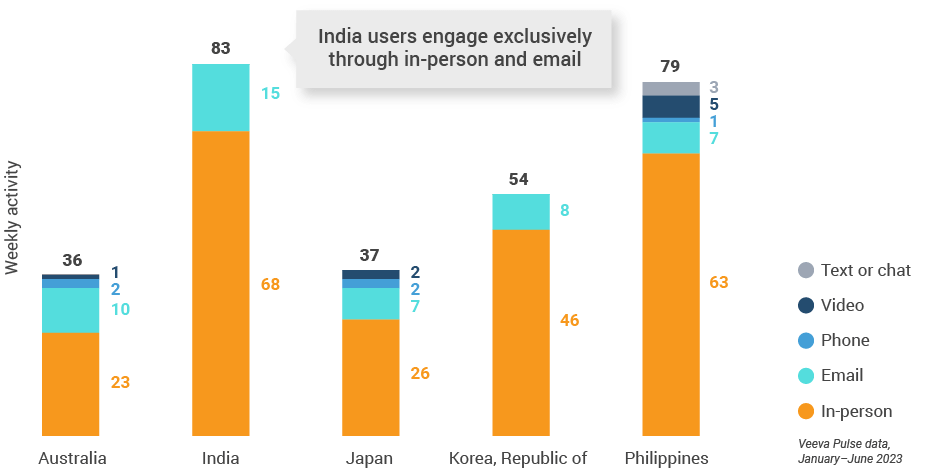
Figure 35: Activity by user type, Asia
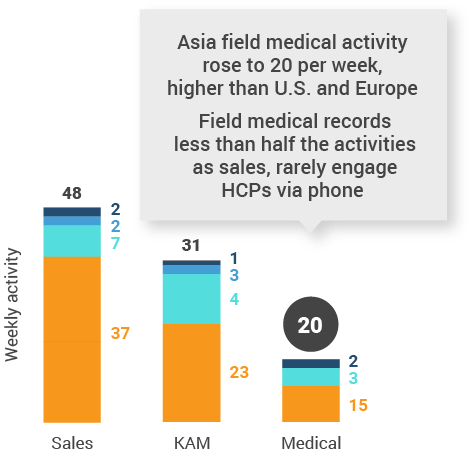
Figure 36: Activity by company size, Asia
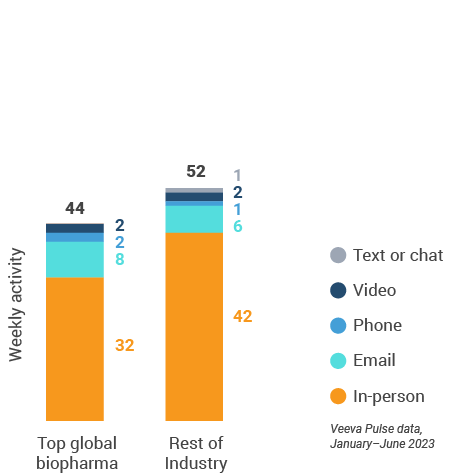
Asia engagement quality Consolidation of key quality metrics
Figure 37: Approved email volume, Asia
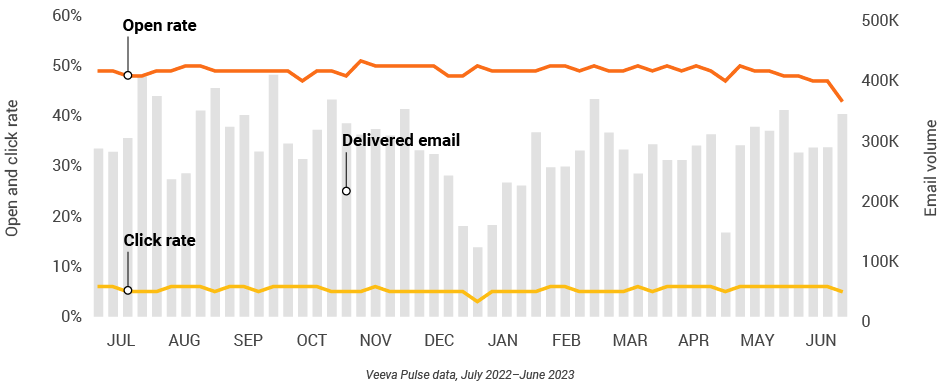
Figure 38: Content usage by channel, Asia
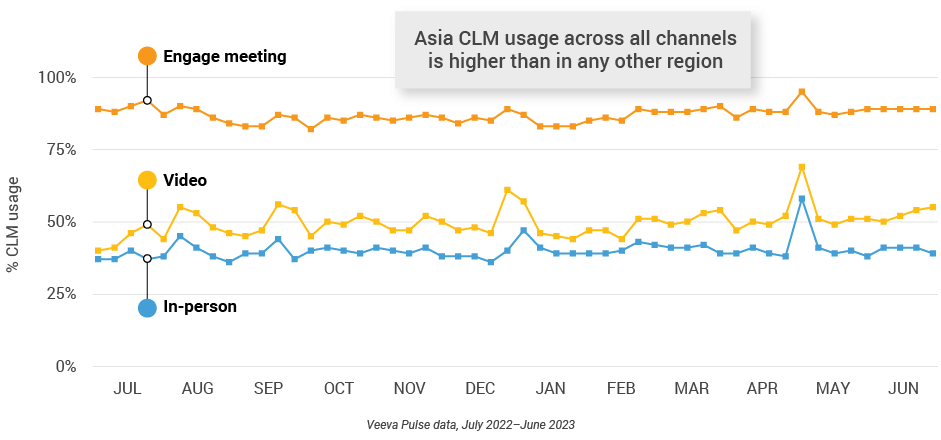
Figure 39: Veeva CRM Engage meeting duration, Asia

Latin America market trends
Figure 40: Channel mix evolution, Latin America
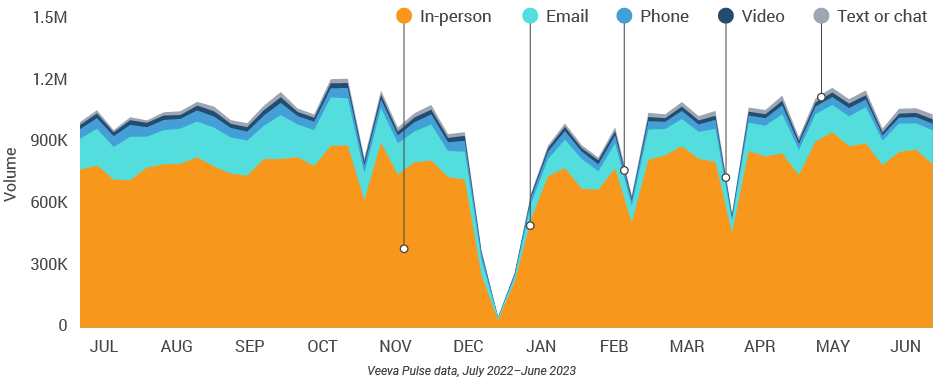
Figure 41: Channel mix, Latin America

Latin America field team activity Weekly activity per user by engagement channel
Figure 42: Activity by country, Latin America
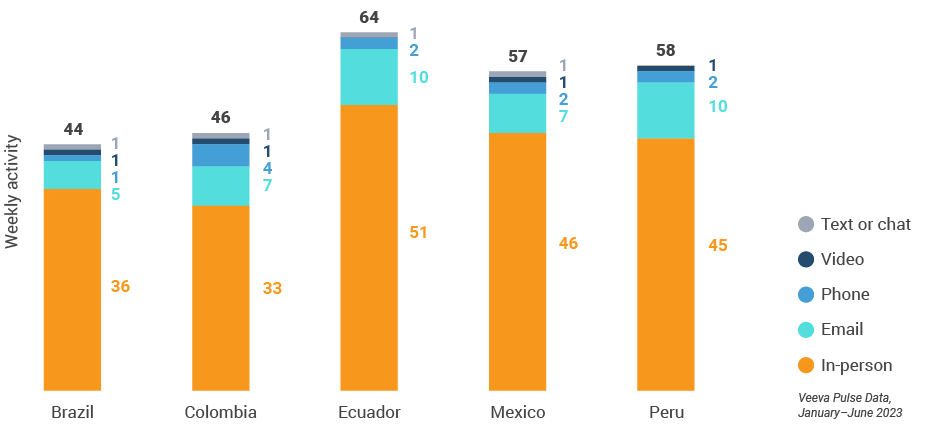
Figure 43: Activity by user type, Latin America
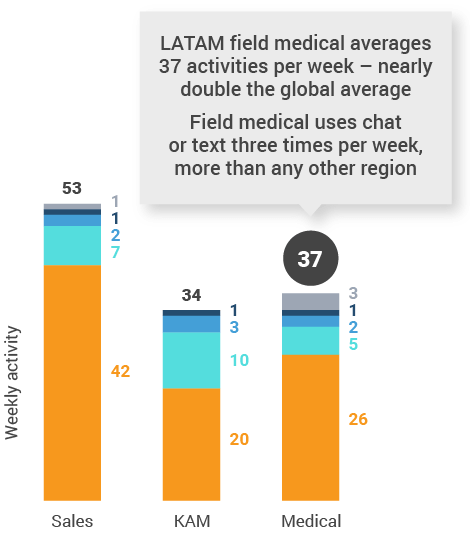
Figure 44: Activity by company size, Latin America
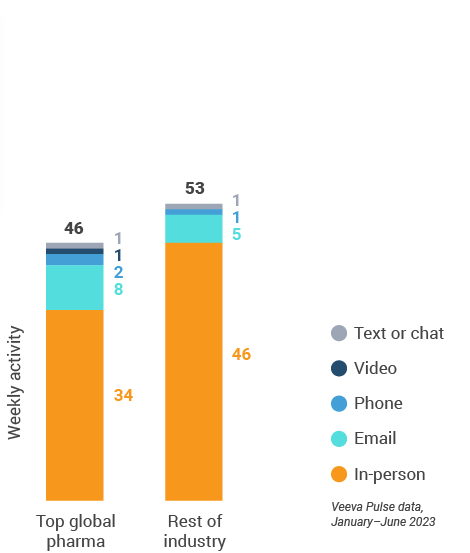
Latin America engagement quality Consolidation of key quality metrics
Figure 45: Approved email volume, Latin America
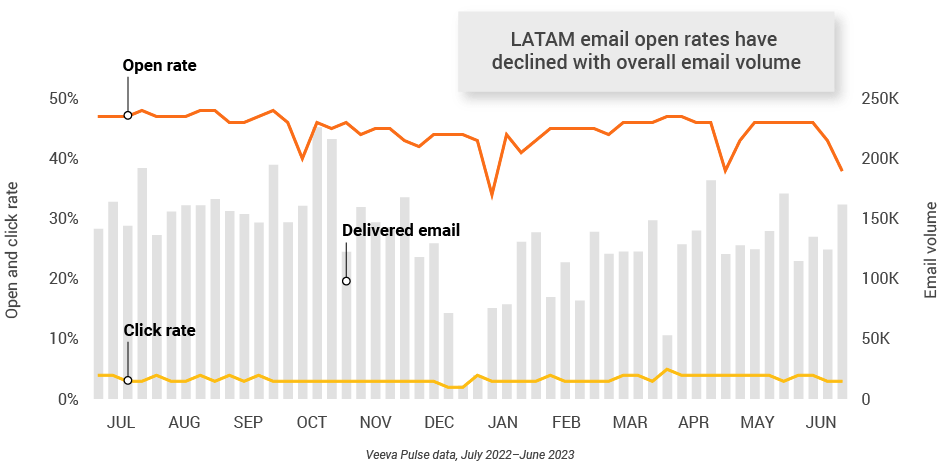
Figure 46: Content usage by channel, Latin America
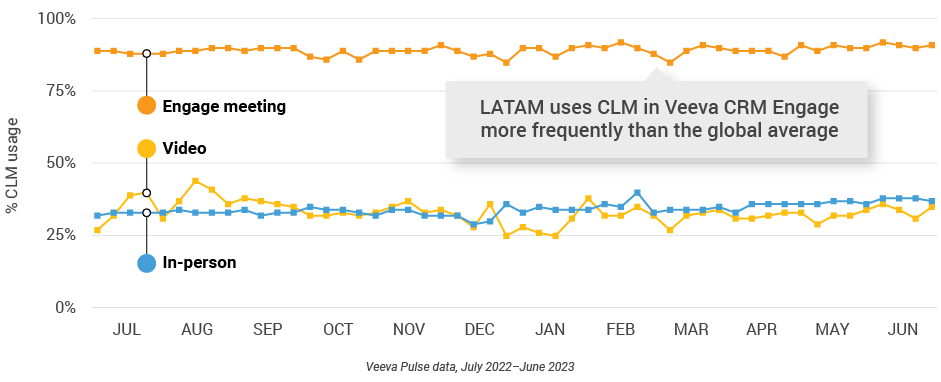
Figure 47: Veeva CRM Engage meeting duration, Latin America

Appendix: Data dictionary
Metric definitions
- Channel mix evolution over time: Weekly Veeva CRM activity volume broken down by the channel of engagement (in-person, phone, video, email, chat, or text)
- Channel mix: Total Veeva CRM activity volume broken down by engagement channel percentage
- Weekly activities per user: The average weekly number of Veeva CRM activities submitted per number of users active in Veeva CRM
- Approved email volume: Volume of approved emails sent via Veeva CRM
- Email open rate: Percentage of approved emails opened at least once out of all approved emails sent via Veeva CRM
- Email click rate: Percentage of approved emails clicked at least once out of all approved emails sent via Veeva CRM
- In-person % CLM usage: Percentage of in-person engagements that leveraged content in Veeva CRM
- Video % CLM usage: Percentage of video engagements that leveraged content in Veeva CRM
- Veeva CRM Engage meeting % CLM usage: Percentage of Veeva CRM Engage meetings that leveraged content in Veeva CRM
- Veeva CRM Engage meeting duration: The average duration of Veeva CRM Engage meetings in minutes
Engagement channel definitions
- In-person: Submitted calls with a CRM Standard Metrics call channel value of ‘in-person’
- Phone: Submitted calls with a CRM Standard Metrics call channel value of ‘phone’
- Video: Veeva CRM Engage calls and video calls via other platforms that are then recorded as calls in Veeva CRM with a Standard Metrics call channel value of ‘video’
- Email: Approved emails and emails sent via other platforms that are then recorded as calls in Veeva CRM with a Standard Metrics call channel value of ‘email’
- Chat or text: Submitted calls with a CRM Standard Metrics call channel value of ‘chat or text’
User type definitions
- Sales: Users that have been classified with the ‘sales’ value in the CRM Standard Metrics user type field
- Key account manager: Users that have been classified with the ‘key account manager’ value in the CRM Standard Metrics user type field
- Medical: Users that have been classified with the ‘medical’ value in the CRM Standard Metrics user type field
- Top global biopharma: Top 17 global biopharma companies by revenue
- Rest of industry: All other biopharmas
Region definitions
- Global: All markets globally
- Europe: Albania, Andorra, Armenia, Aruba, Austria, Azerbaijan, Belarus, Belgium, Bermuda, Bosnia and Herzegovina, Bulgaria, Croatia, Cyprus, Czech Republic, Denmark, Estonia, Finland, France, French Polynesia, Georgia, Germany, Greece, Greenland, Guadeloupe, Guernsey, Hungary, Ireland, Italy, Jersey, Latvia, Lithuania, Luxembourg, Macedonia, Malta, Martinique, Republic of Moldova, Monaco, Montenegro, Netherlands, New Caledonia, Norway, Poland, Portugal, Romania, Serbia, Slovakia, Slovenia, Spain, Sweden, Switzerland, Ukraine, United Kingdom
- Asia: Australia, Bangladesh, Bhutan, Brunei Darussalam, Cambodia, Cocos (Keeling) Islands, Indonesia, Japan, Kazakhstan, Republic of Korea, Kyrgyzstan, Malaysia, Mongolia, Myanmar, Nauru, Nepal, New Zealand, Philippines, Samoa, Singapore, Solomon Islands, Sri Lanka, Taiwan, Tajikistan, Thailand, Turkmenistan, Uzbekistan, Vietnam
- Latin America: Antigua and Barbuda, Argentina, Bahamas, Barbados, Belize, Bolivia, Brazil, Chile, Colombia, Costa Rica, Cuba, Dominican Republic, Ecuador, El Salvador, Guatemala, Guyana, Haiti, Honduras, Jamaica, Mexico, Nicaragua, Panama, Paraguay, Peru, Trinidad and Tobago, Uruguay, Venezuela
Methodology
The Veeva HCP 360 Trends Report is a quarterly industry benchmark for global and regional healthcare professional (HCP) engagement across the life sciences industry. The report is based on proprietary Veeva Pulse data and insights from field engagement activities of more than 80% of all industry representatives worldwide (Asia Pacific, Europe, Latin America, and the United States). Veeva CRM Standard Metrics — now used industrywide — provides the basis for consistent collection and measurement of engagement KPIs including channel mix and productivity across regions, roles, and market segments. The findings are based on:
- Approximately 600 million annual global field activities captured in Veeva CRM and Veeva CRM Engage
- 60 billion prescription (Rx) and medical (Mx) records captured in Veeva Compass Patient, a U.S.-based granular patient data set
- 3+ million profiles containing publications, clinical trials, conferences, associations, guidelines, grants, payments, social media, news mentions, and influence on community practice from Veeva Link Key People across 85+ countries and 24 therapeutic areas
- Global reference data of healthcare professionals, healthcare organizations, and affiliations from Veeva OpenData, containing addresses, emails, specialties, demographics, and compliance data (license information and industry identifiers) available in 65+ countries today and 100+ countries by end of 2023
The Veeva Pulse Field Trends Report delivers insights that inform the industry and help field teams align their strategy to key market trends for improved commercial success. The global Veeva Business Consulting team also helps customers inform their strategies using industry benchmarking with Veeva Pulse data.
