Tracking CAR-T Adoption: Navigating Data Challenges to Understand Market Growth
Combining CMS and Veeva Compass claims data unlocks insights into CAR-T market dynamics, brand performance, and 2,300+ healthcare treaters.
Executive Summary
- Chimeric Antigen Receptor T-cell (CAR-T) therapies are a source of major investment and treatment progress in the advanced oncology space in recent years.
- These therapies are particularly challenging to analyze due to the way the inpatient administration presents themselves in claims datasets.
- Leveraging data from both the Centers for Medicare & Medicaid Services (CMS) census treatment data and Veeva Compass enables an analytical understanding of CAR-T therapies commercialization to date.
- This analytic approach enables visibility into performance tracking and differing market dynamics, like CMS's coverage decisions within the CAR-T therapeutic class and individual brands.
- Using combined, complementary claims universes extends healthcare provider (HCP) visibility to over 2,300 CAR-T treaters and their treatment volume.
CAR-T Therapy Overview
CAR-T therapies are a relatively recent but extremely impactful evolution of cancer treatment, and therapeutics in general. Unlike traditional treatments like chemotherapy or radiation, which use chemicals or energy to kill cancer, CAR-T is a gene therapy that uses the body's immune system to fight the disease.
In 2017, Kymriah was the first CAR-T and gene therapy approved in the U.S. Since then, there have been a number of other gene therapies approved including six CAR-T. To date, they are primarily used to treat blood cancers among patients with prior failed treatments.
- 2017 – Initial Launches: Kymriah and Yescarta established the CAR-T market, targeting Acute Lymphoblastic Leukemia, Diffuse Large B-cell Lymphoma, and Follicular Lymphoma.
- 2020–2021 – Lymphoma & Leukemia Expansion: Tecartus and Breyanzi launched, capturing a wider array of indications including Mantle Cell, Marginal Zone, and Chronic Lymphocytic Leukemias/Lymphomas.
- 2021–2022 – The Multiple Myeloma Opportunity: Abecma and Carvykti were approved exclusively for Multiple Myeloma, opening up entirely new patient populations.
- 2024 – Continued Entry: Aucatzyl was recently approved to further address Acute Lymphoblastic Leukemia.
Building on the success of early therapies in the space, there has been a recent wave of M&A focused specifically on CAR-T therapies, including nearly $20 billion in deals in 2025 and 2026. Most recently, Lilly and Gilead each spent over $7B in 2026, which is emblematic of where the industry sees the next generation of oncology and immunotherapy treatments advancing.
With this level of investment, there will be an expectation to successfully commercialize CAR-T therapies, which will require a data-driven understanding of the ecosystem. The right data and analytics approach can help drive important commercial planning inputs like historic uptake of the existing therapies, HCP treatment patterns, and trends across different payer types. This type of data analysis isn't unique to CAR-T therapies and is standard practice. However, this class of therapies is more challenging from an analytics and data visibility standpoint.
The primary challenges are:
- Multiple code sets are needed due to variable billing patterns that leverage NDC, HCPCS (outpatient), and ICD-10-PCS (inpatient) procedure codes.
- Inpatient Medical Claim formats make analyzing CAR-T therapies particularly complex. These therapies are most often captured via ICD-10-PCS codes on inpatient claims due to the nature of the therapy. This means they appear in a different format than typical outpatient treatments. These codes reside on the claim header (the high level summary for the hospital stay) rather than on individual service line items (the granular daily itemizations) or on a charge line basis like a HCPCS (j-code). This causes the ICD-10-PCS to repeat itself for each service line, and therefore aggregating the claims to calculate total treatments or market share would cause overcounting if not done correctly.
- Data maturity is a consistent challenge for Medical Claims, due to the longer time it takes for some claims to be received. This causes an incomplete view of volume, trending, and who is treating. This is especially true for higher-cost and complex inpatient therapies because a medical event cannot appear in the dataset until the hospital bills it and the claim is processed. A hospital billing department typically does not bundle, review, and submit the institutional claim until after the patient is discharged — often longer for inpatient stays given the length of stay and number of treatments involved. For a complex CAR-T stay, the administration process can take three to four months before the claim fully populates across clearinghouses.
- Claims data capture limits how representative of total market volume a given claims set is. Claims datasets only capture a subset of transactions, so there is a bias towards where there is data and away from where there is not. This often shows itself by understating the number of HCPs administering a specific treatment and the volume of administrations itself.
- HCP visibility is a common hurdle for medical claims. Sometimes, the HCP tagged on the claim is a care provider, but not necessarily the core treatment decision maker. In other cases, the HCP tagged as the rendering treater is a healthcare organization (HCO) and not an HCP at all. This is possible, for example, when a claim is submitted at an HCO level for a clinic or infusion center.
Data Sources and Methodology
To navigate these data challenges, this analysis synthesizes data from two distinct, high-fidelity sources: Veeva Compass and the Centers for Medicare & Medicaid Services. By combining advanced statistical projections with exhaustive federal census counts, this methodology delivers a comprehensive view of the CAR-T therapy landscape, capturing both macro market trends and granular provider-level utilization.
Veeva Compass
The Veeva Compass Data Network integrates longitudinal prescription and medical claims data to provide an un-siloed view of complex therapeutic markets. Compass Patient is anonymous patient longitudinal data (APLD) for the U.S. market, including dispensed prescriptions, procedures, and diagnoses. Compass Patient has broad medical and prescription claim coverage. Compass National and Compass Prescriber provide longitudinally projected prescription and procedure volumes at the HCP, HCO, ZIP, state, and national levels across over 4,000 branded and generic medicines. The use of projected data allows for a complete market view, supplementing the Compass Patient subset so that it is representative of the entire U.S. market.
In this analysis, Compass National is utilized to evaluate macro CAR-T market dynamics, including launch trajectories, competitive landscapes, and high-level payer mixes. Additionally, this analysis utilizes Compass Prescriber to identify, rank, and understand HCPs' estimated CAR-T utilization.
To align with standard industry reporting, payers are categorized into three distinct groups:
- Medicare: Inclusive of Fee-For-Service (FFS), Medicare Advantage, and Dual Eligible transactions.
- Medicaid: Inclusive of traditional and managed Medicaid programs, excluding Dual Eligible transactions.
- Commercial: Encompasses all other transactions, notably private or employer-sponsored transactions.
Centers for Medicare & Medicaid Services
To validate and enrich these Compass projections, as well as to obtain the census of relevant HCPs & CAR-T treatments, the analysis incorporates 100% population databases from the Chronic Conditions Warehouse (CCW). The CCW dataset covers the complete universe of claims for:
- Medicare FFS
- Medicare Advantage
- State Medicaid programs
CCW data extracts provide aggregated, absolute population counts of CAR-T administrations, as well as HCPs who have administered them.
Combining Sources for Comprehensive Market Coverage
Due to CAR-T's distinct data challenges, here is a detailed breakdown of the inherent limitations of each standalone data source, paired with how the strategic combination of the Veeva Compass data and the CMS CCW mitigates them.
While the CMS CCW provides full population census counts for public healthcare programs, it entirely lacks commercial data. Conversely, the Compass Data Network captures robust specialty and medical claims activity, but that is still a subset and does not inherently capture 100% of all practicing HCPs administering CAR-T.
Used in combination, the datasets overlap and complement each other in lines of business. The commercial claims within Veeva Compass fills the private-payer void in the CCW database. Conversely, the 100% census data within the CCW fills any network blind spots for Medicare and Medicaid in Compass. Blending these sources yields a comprehensive, multi-market perspective and high coverage of relevant CAR-T providers.
Similarly, from a historic data perspective, the two sources complement each other. The Compass National and Compass Prescriber data provides a comprehensive view across Commercial, Medicare, and Medicaid programs from 2022 until present. However, many CAR-T therapies were launched prior to that period. In order to maintain performance visibility through the full launch period, CMS CCW and unprojected commercial claims from Compass Patient are used to complete the picture. This avoids the partial history of Compass National and Compass Prescriber, and the incomplete recent history of CMS CCW due to federal reporting lags.
Performance Metrics
The scope of this analysis encompasses the utilization of the seven approved CAR-T therapies, tracking market dynamics from 2018. The primary metrics were focused on Treatments and HCP Count:
- Treatments (Tx): The total count of prescriptions and procedures. For CAR-T therapies, administrations captured via medical claims are most common.
- HCP Count: The distinct number of HCPs treating patients with CAR-T therapies as captured through the rendering HCP for each analyzed claims universe.
CAR-T Market Growth
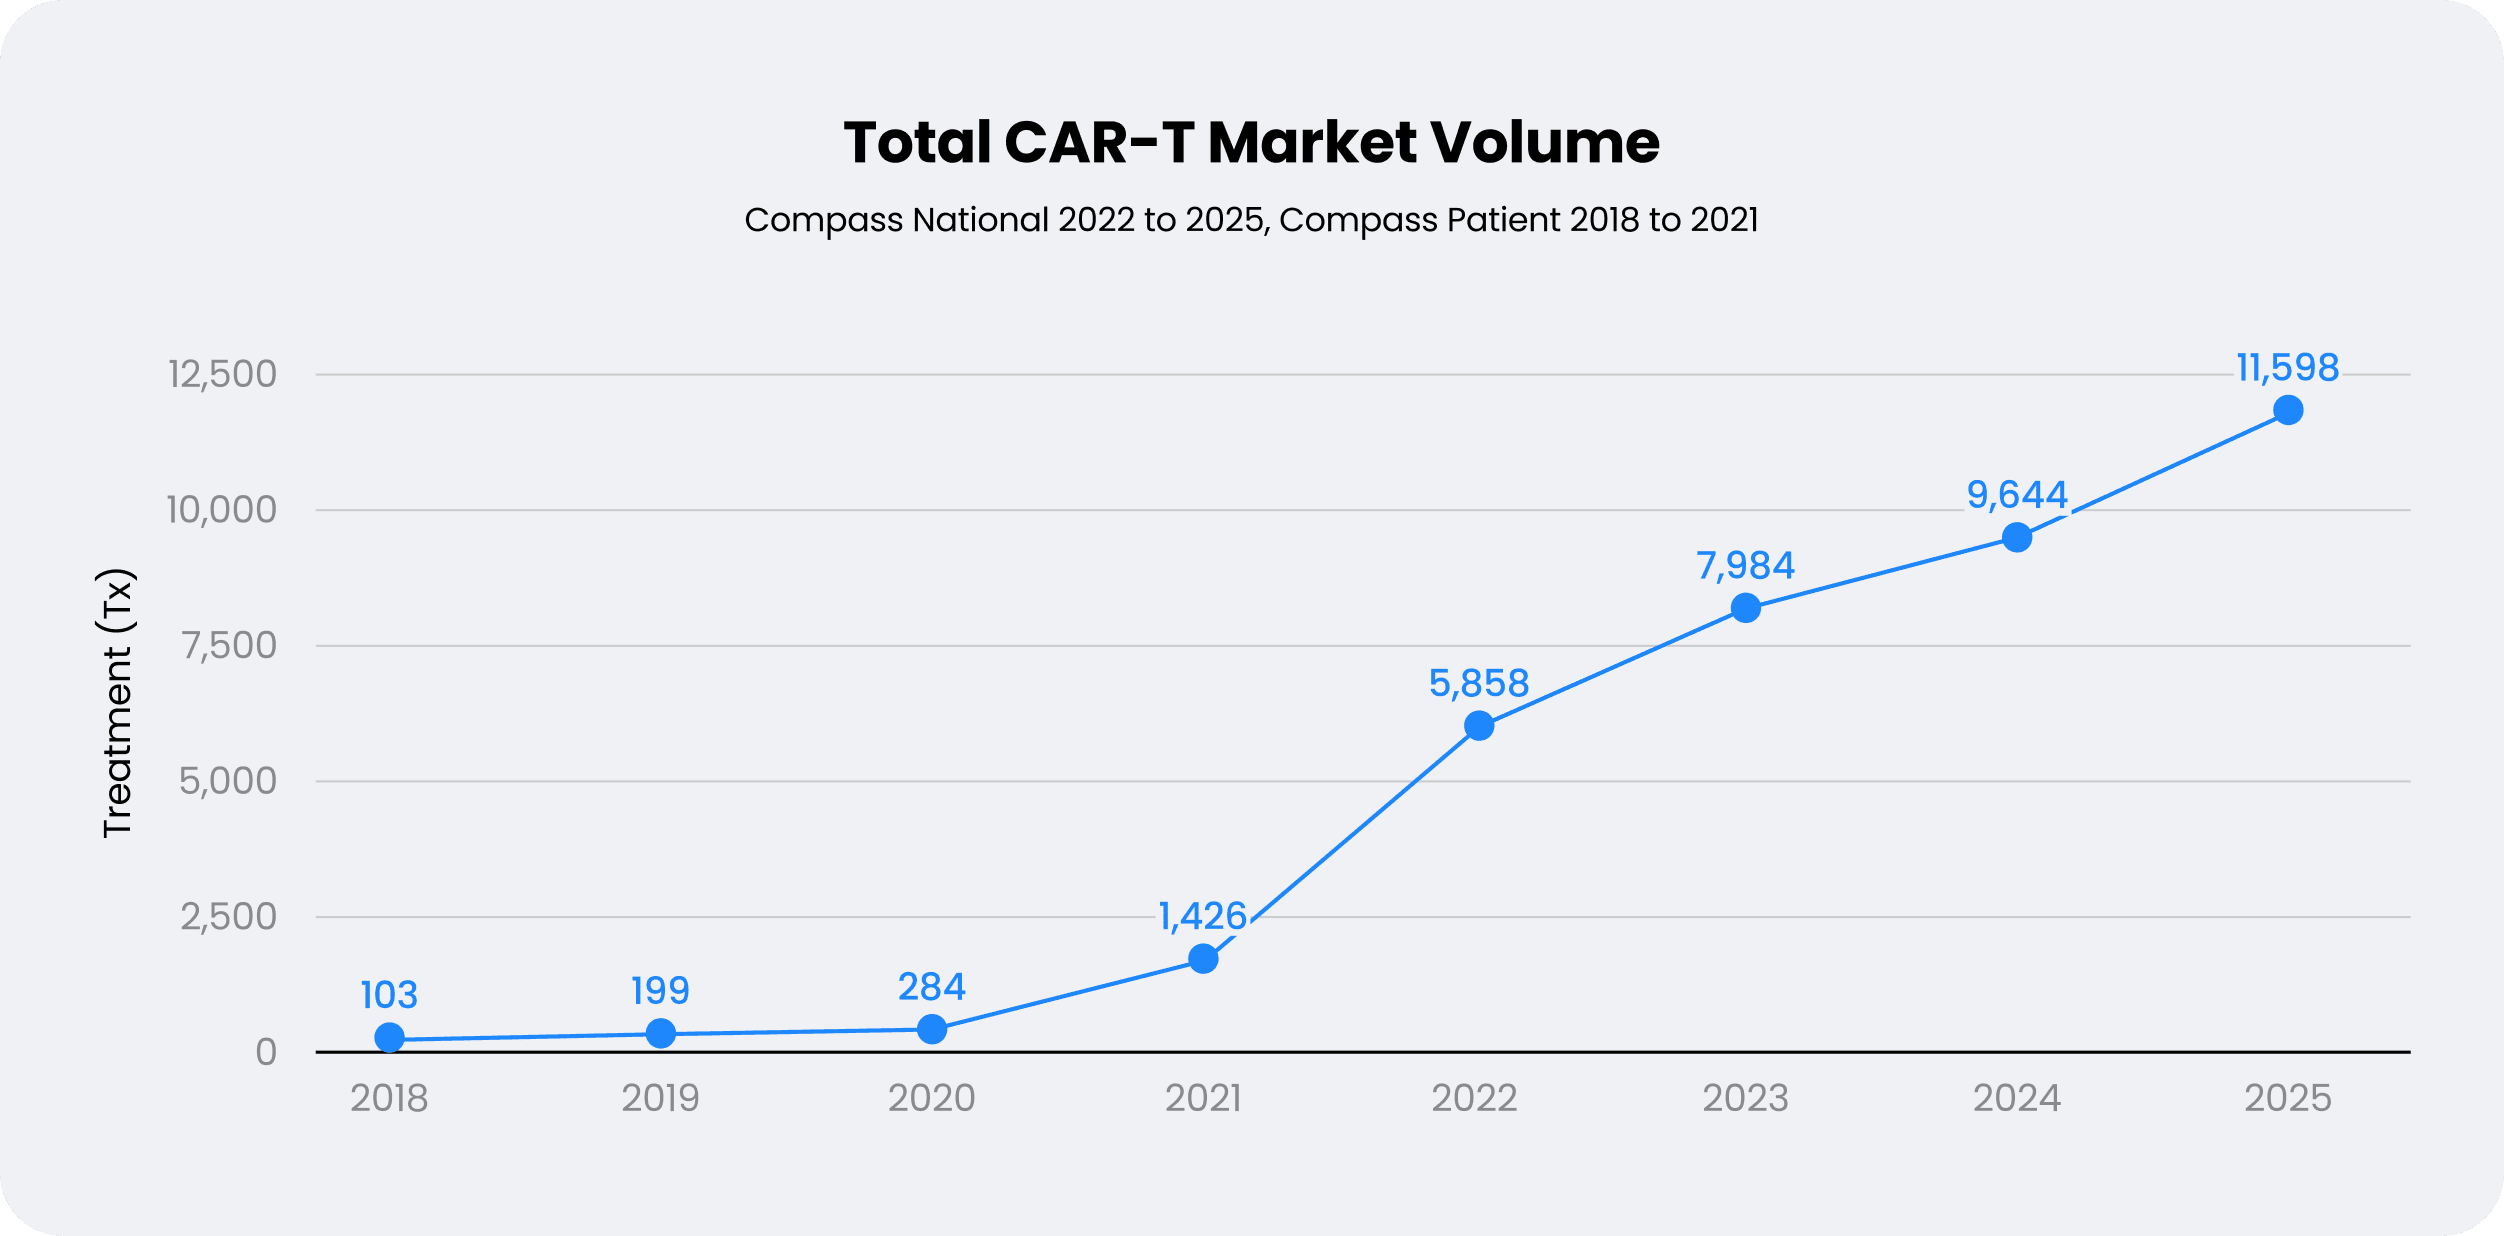
As a new therapeutic class, it is interesting to see both how the CAR-T therapies individually have trended, and holistically how adoption has progressed. The initial launches of Kymriah and Yescarta were indicative of general apprehension towards the products with modest growth in the first three years of availability. Although it was not immediate, these products paved the way for subsequent launches. Importantly these two therapies gained CMS coverage in 2019, unblocking reimbursement challenges and also getting early commercial experience and traction.
The initial inertia gives way to a market shift from 2021 to 2022, which is really an inflection point for CAR-T therapies. What were a few hundred treatments for two products per year in 2020 increased ~2000% to 5,858 treatments (Tx) for six CAR-T products in 2022.
These therapies have continued on a high-growth trajectory since. Even after the jump in volume from 2022, the CAR-T usage continues to stack market growth with a compounded annual growth rate of ~25% from 2022 to 2025. This higher growth rate is driven by both new product launches and expansions of existing products' indications, as well as the depth of those treatments' utilization with HCPs. The growing awareness and use helps accelerate the momentum, which the recent industry investments will continue to push.
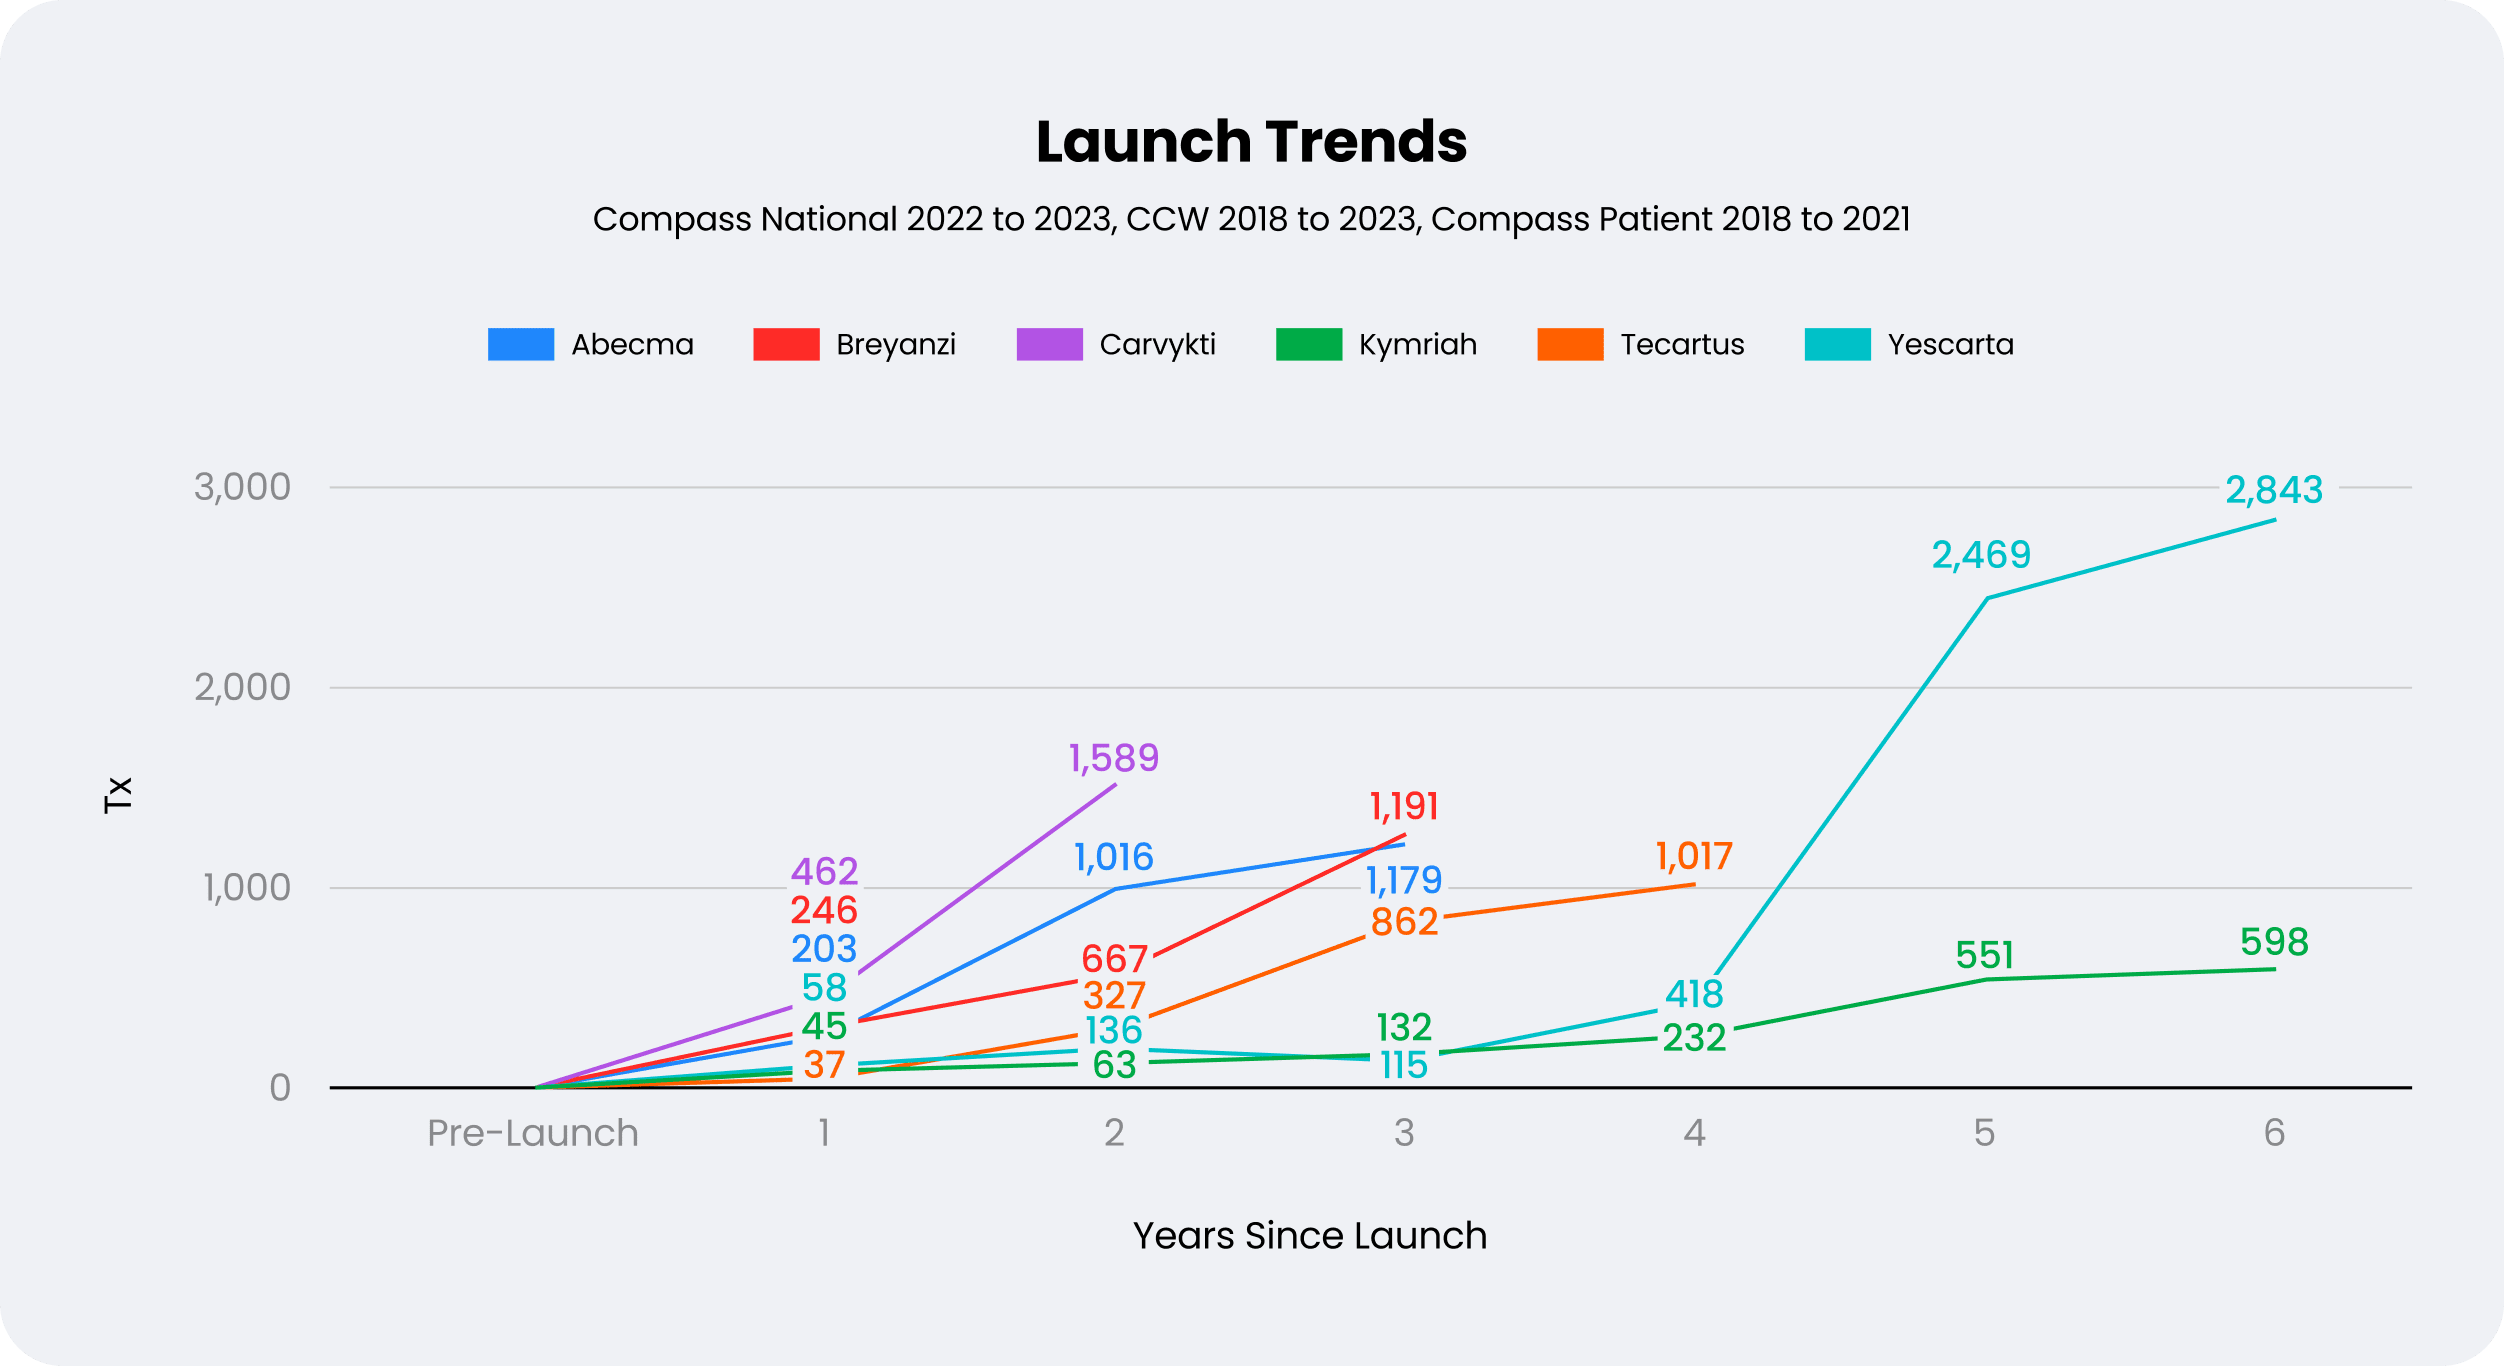
This is apparent on the individual launch level. The slow uptake of the first two launches is no longer observed in the next wave. Abecma, Breyanzi, Carvykti, and Tecartus have much faster uptake, with Carvykti leading the way in terms of acceleration from initial launch.
Even Yescarta turned the corner from its modest early performance to be the largest therapeutic treatment driver. This was driven by new indications expansions in 2021 and 2022, that allowed earlier line of therapy use in Large B-Cell Lymphoma and a new patient population altogether with follicular Lymphoma.
Despite a similar timeline as Yescarta, Kymriah never hit that inflection point. Yescarta and Breyanzi's availability and efficacy within the same indication appears to have stymied Kymriah's growth potential. Additionally, Kymriah's indication is more focused on targeting children and young adults — a limited population that may entail additional clinical considerations.
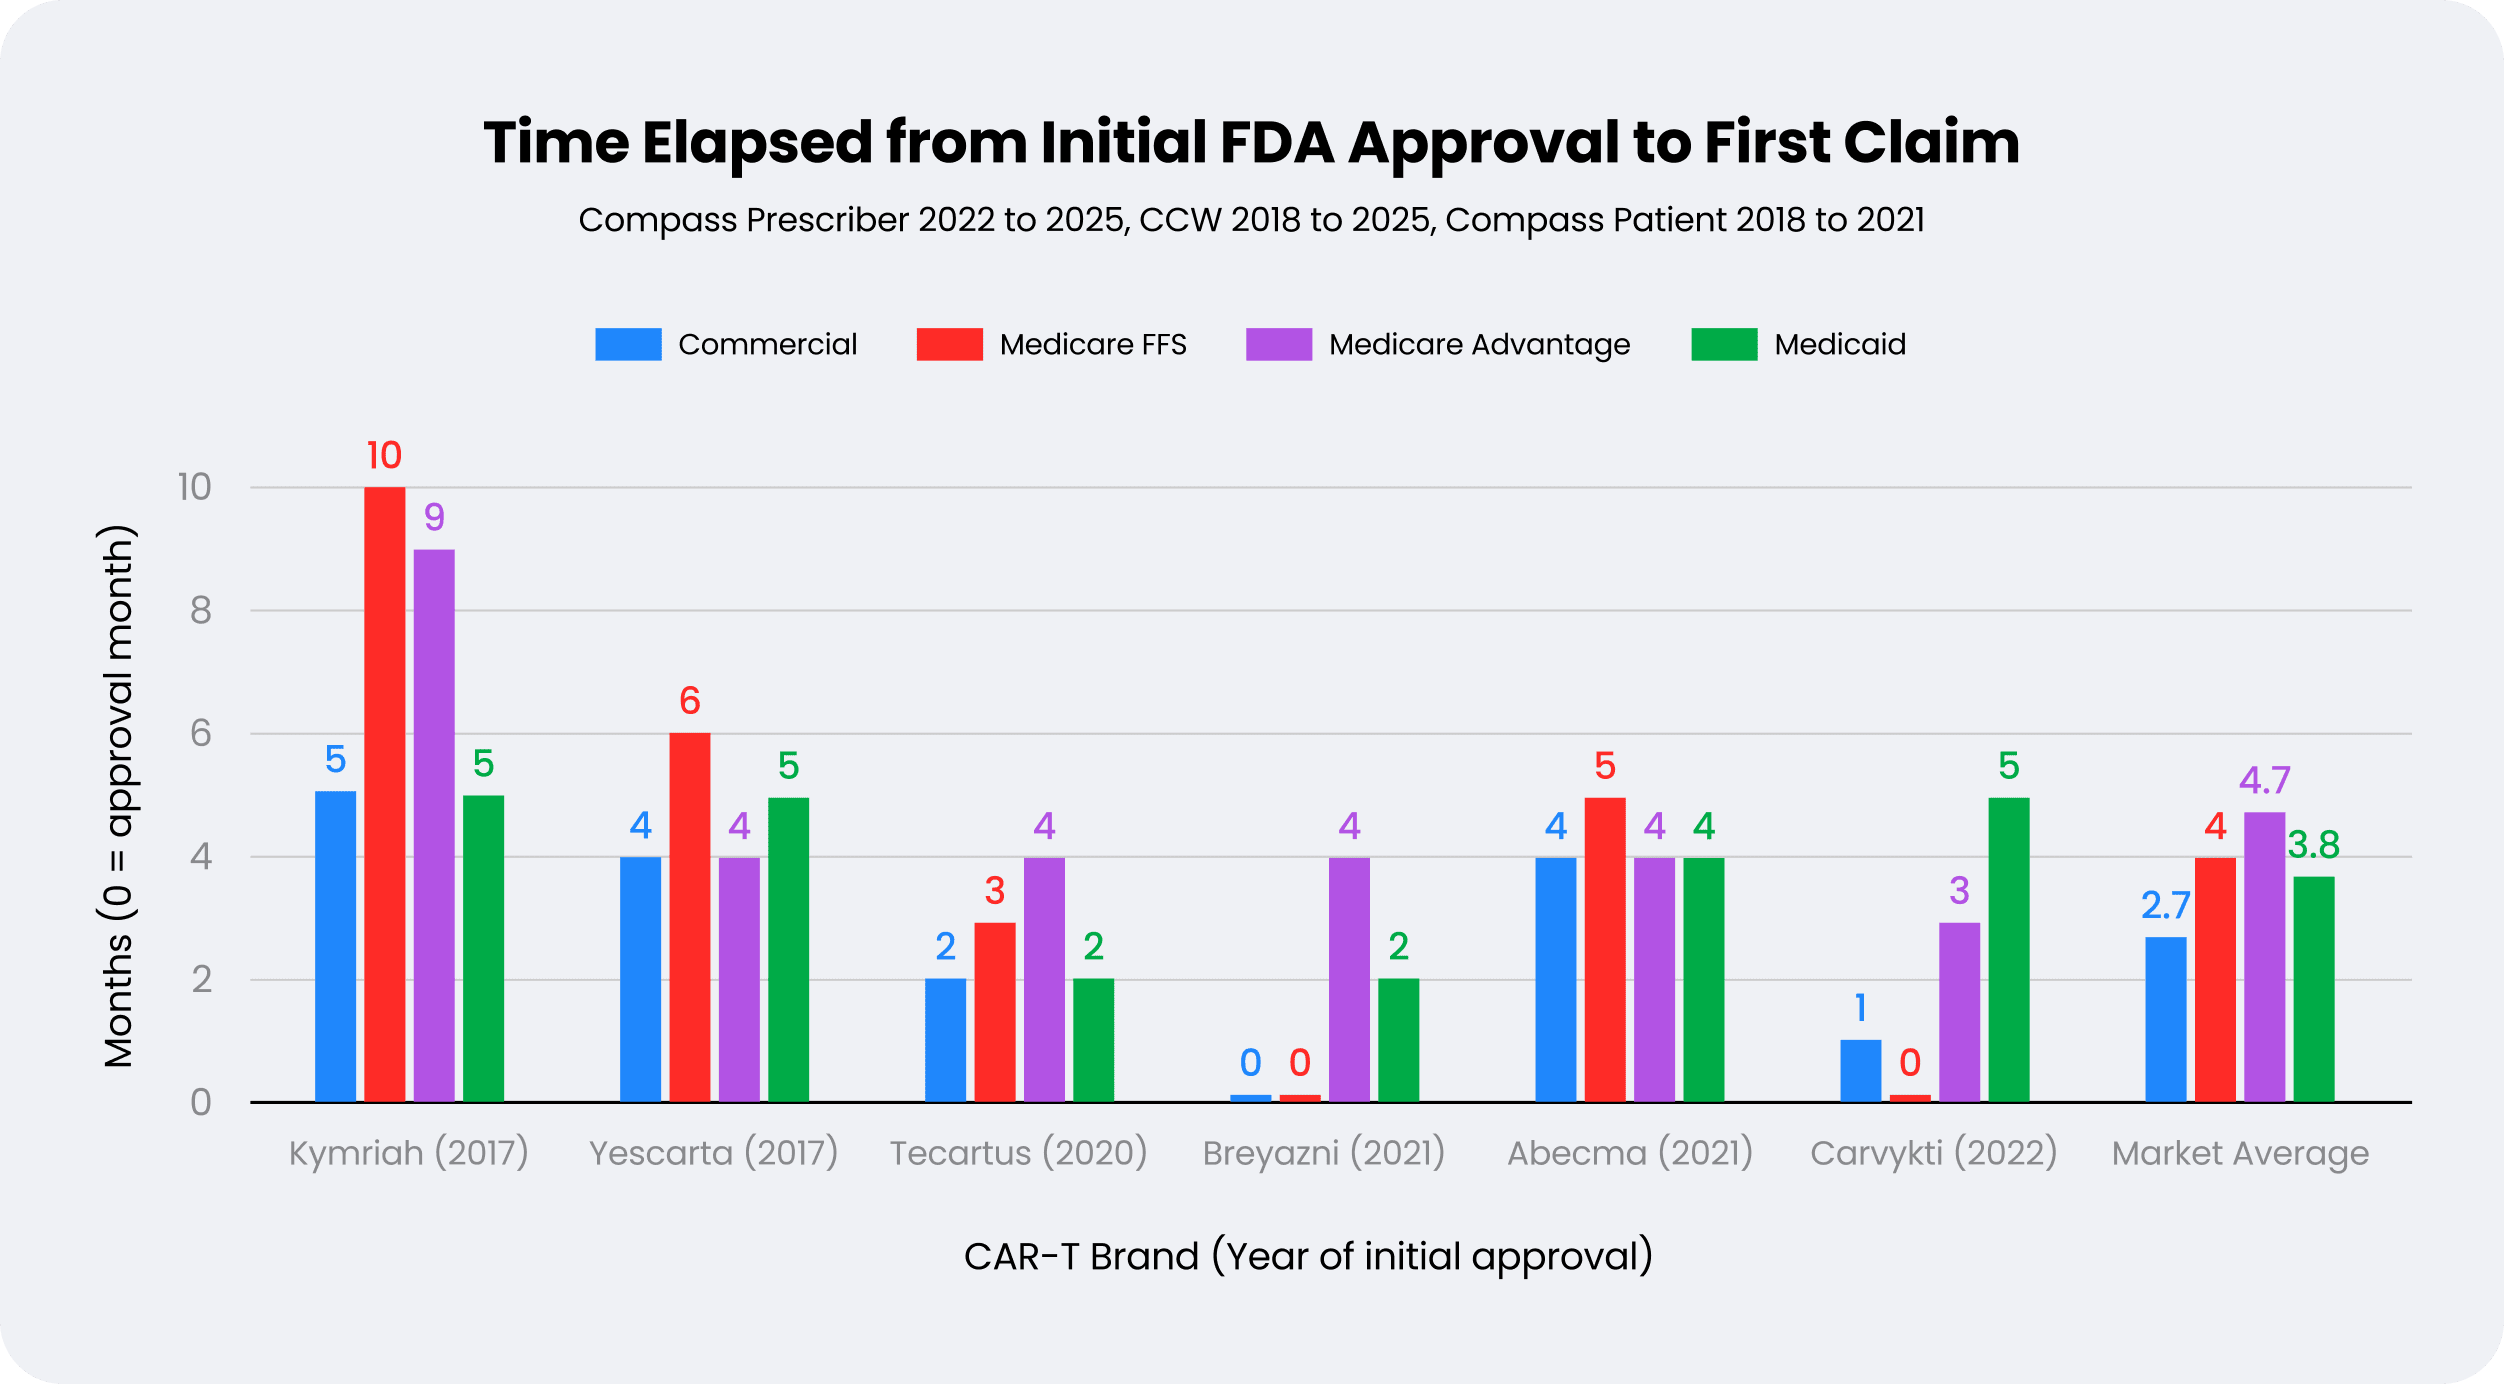
The expanded adoption of CAR-T therapies becomes clearer when analyzing time-to-first-claim for each brand. On average, CAR-T brands saw treatment claims for Medicare, Medicaid, and commercial insurers all within five months of initial approval. Commercial time to treatments has been typically faster at less than three months, and Medicare Advantage the slowest. The timing differences across payer types have narrowed with the more recent launches, but that wasn't always the case.
The first CAR-T approvals in 2017 for Kymriah and Yescarta took at least five and four months, respectively, for the first commercial claims to be filed. Medicare Fee-For-Service took even longer for Kymriah with 10 months elapsed, and Yescarta almost six months. At this point, there was a lot of market and reimbursement friction due to the novel class and high cost of therapy.
However, in 2019 the CMS National Coverage Determination provided much-needed guidance on use and reimbursement for CAR-T products. This was a critical domino to fall. The subsequent therapy approved after the CMS decision was Tecartus in 2020, and its time-to-first-claim was only two months, and had claims across all payer types after only months. Next up was Breyanzi, which was approved in 2021. Breyanzi saw both its first commercial and Medicare claim generated in the same month as it was approved. This trend towards faster delivery of potentially life-saving CAR-T treatments to patients is encouraging for patient access and lowered hurdles for future launches.
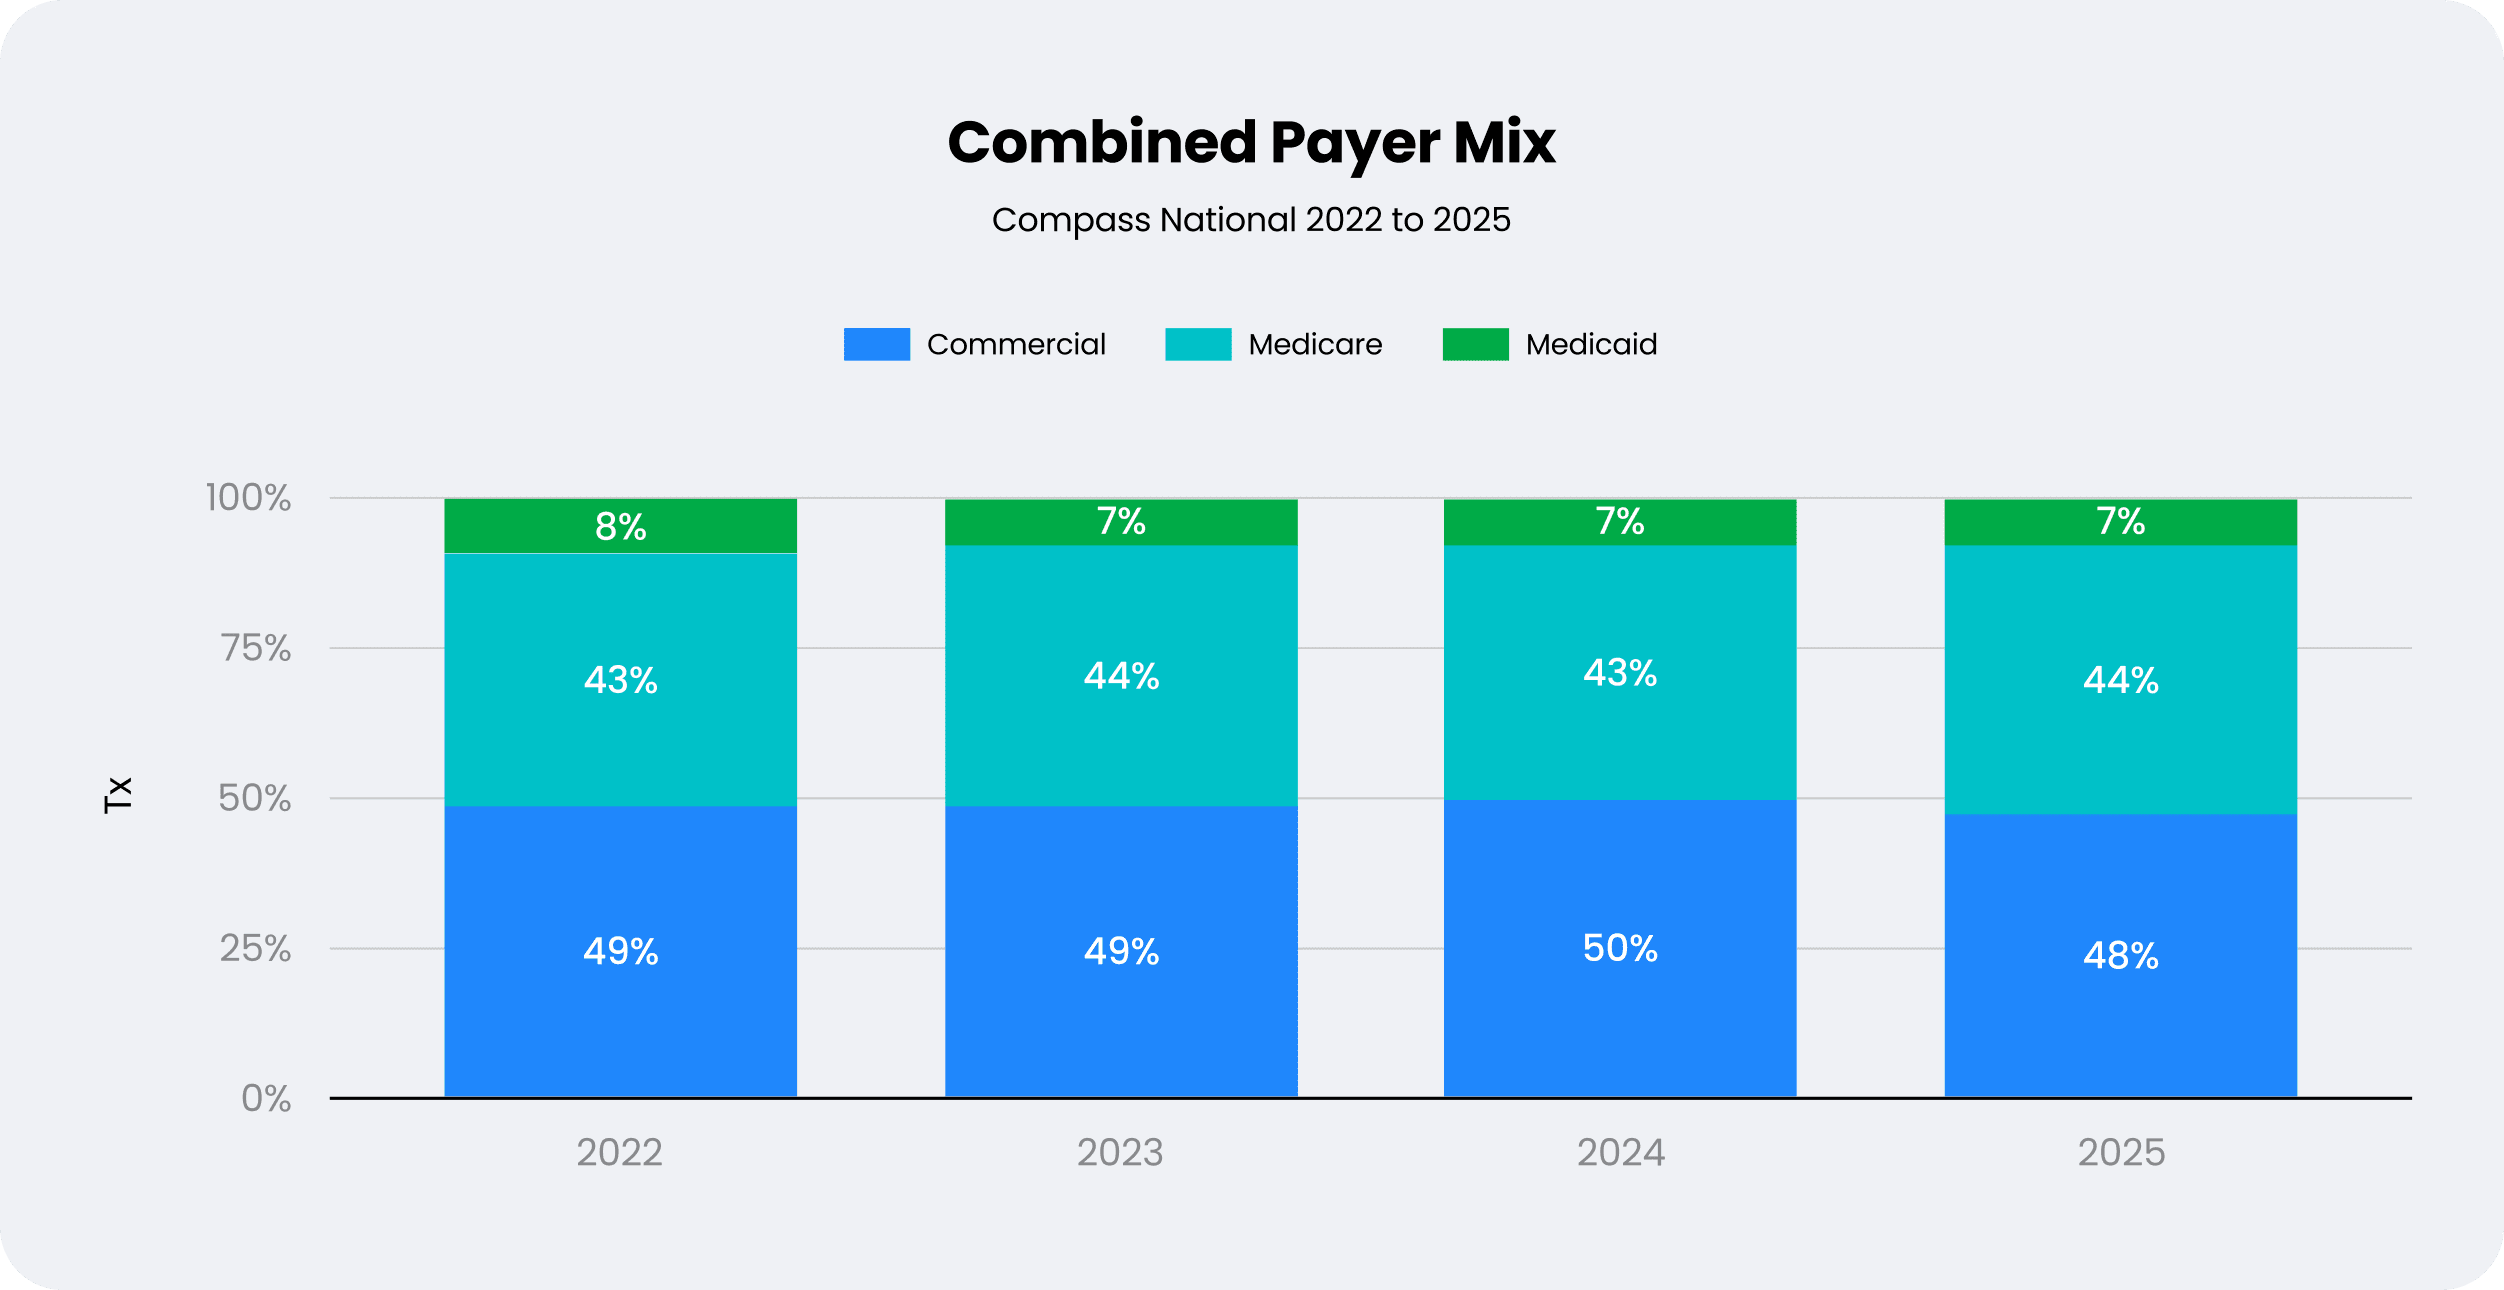
After some slight initial timing differences, the contribution by payer type is well distributed across Medicare and Commercial volume. This volume split also holds steady over time for both individual treatments, but also the therapeutic class in general. For the last four years, the payer mix has been consistent with Commercial volume hovering around 50% and Medicare 42%. This could be an indicator of CAR-Ts becoming an established market, with the maturation of the market access dynamics.
Most brands follow a similar distribution with 90% of volume coming from the combination of Commercial and Medicare coverage. Kymriah and Aucatzyl are the outliers in this regard, seeing higher Medicaid usage than Medicare. This is likely driven by the fact that their ALL indications treat a predominantly younger population that would more likely be on Medicaid. Kymriah even has an explicit age cap of 25 years old on its original indication.
CAR-T HCP Adoption
Understanding the actual prescribers and the penetration into the HCP base is an important part of measuring the launch and utilization of any therapy. This is particularly true when it's a specialty market with a complex administration. The willingness to trial, and even the clinical skillset become major considerations and even limitations. Using a distinct HCP list combining CCW, Compass Prescriber, and Compass Patient provides a comprehensive perspective that is near-complete for Commercial and complete for Medicare and Medicaid.
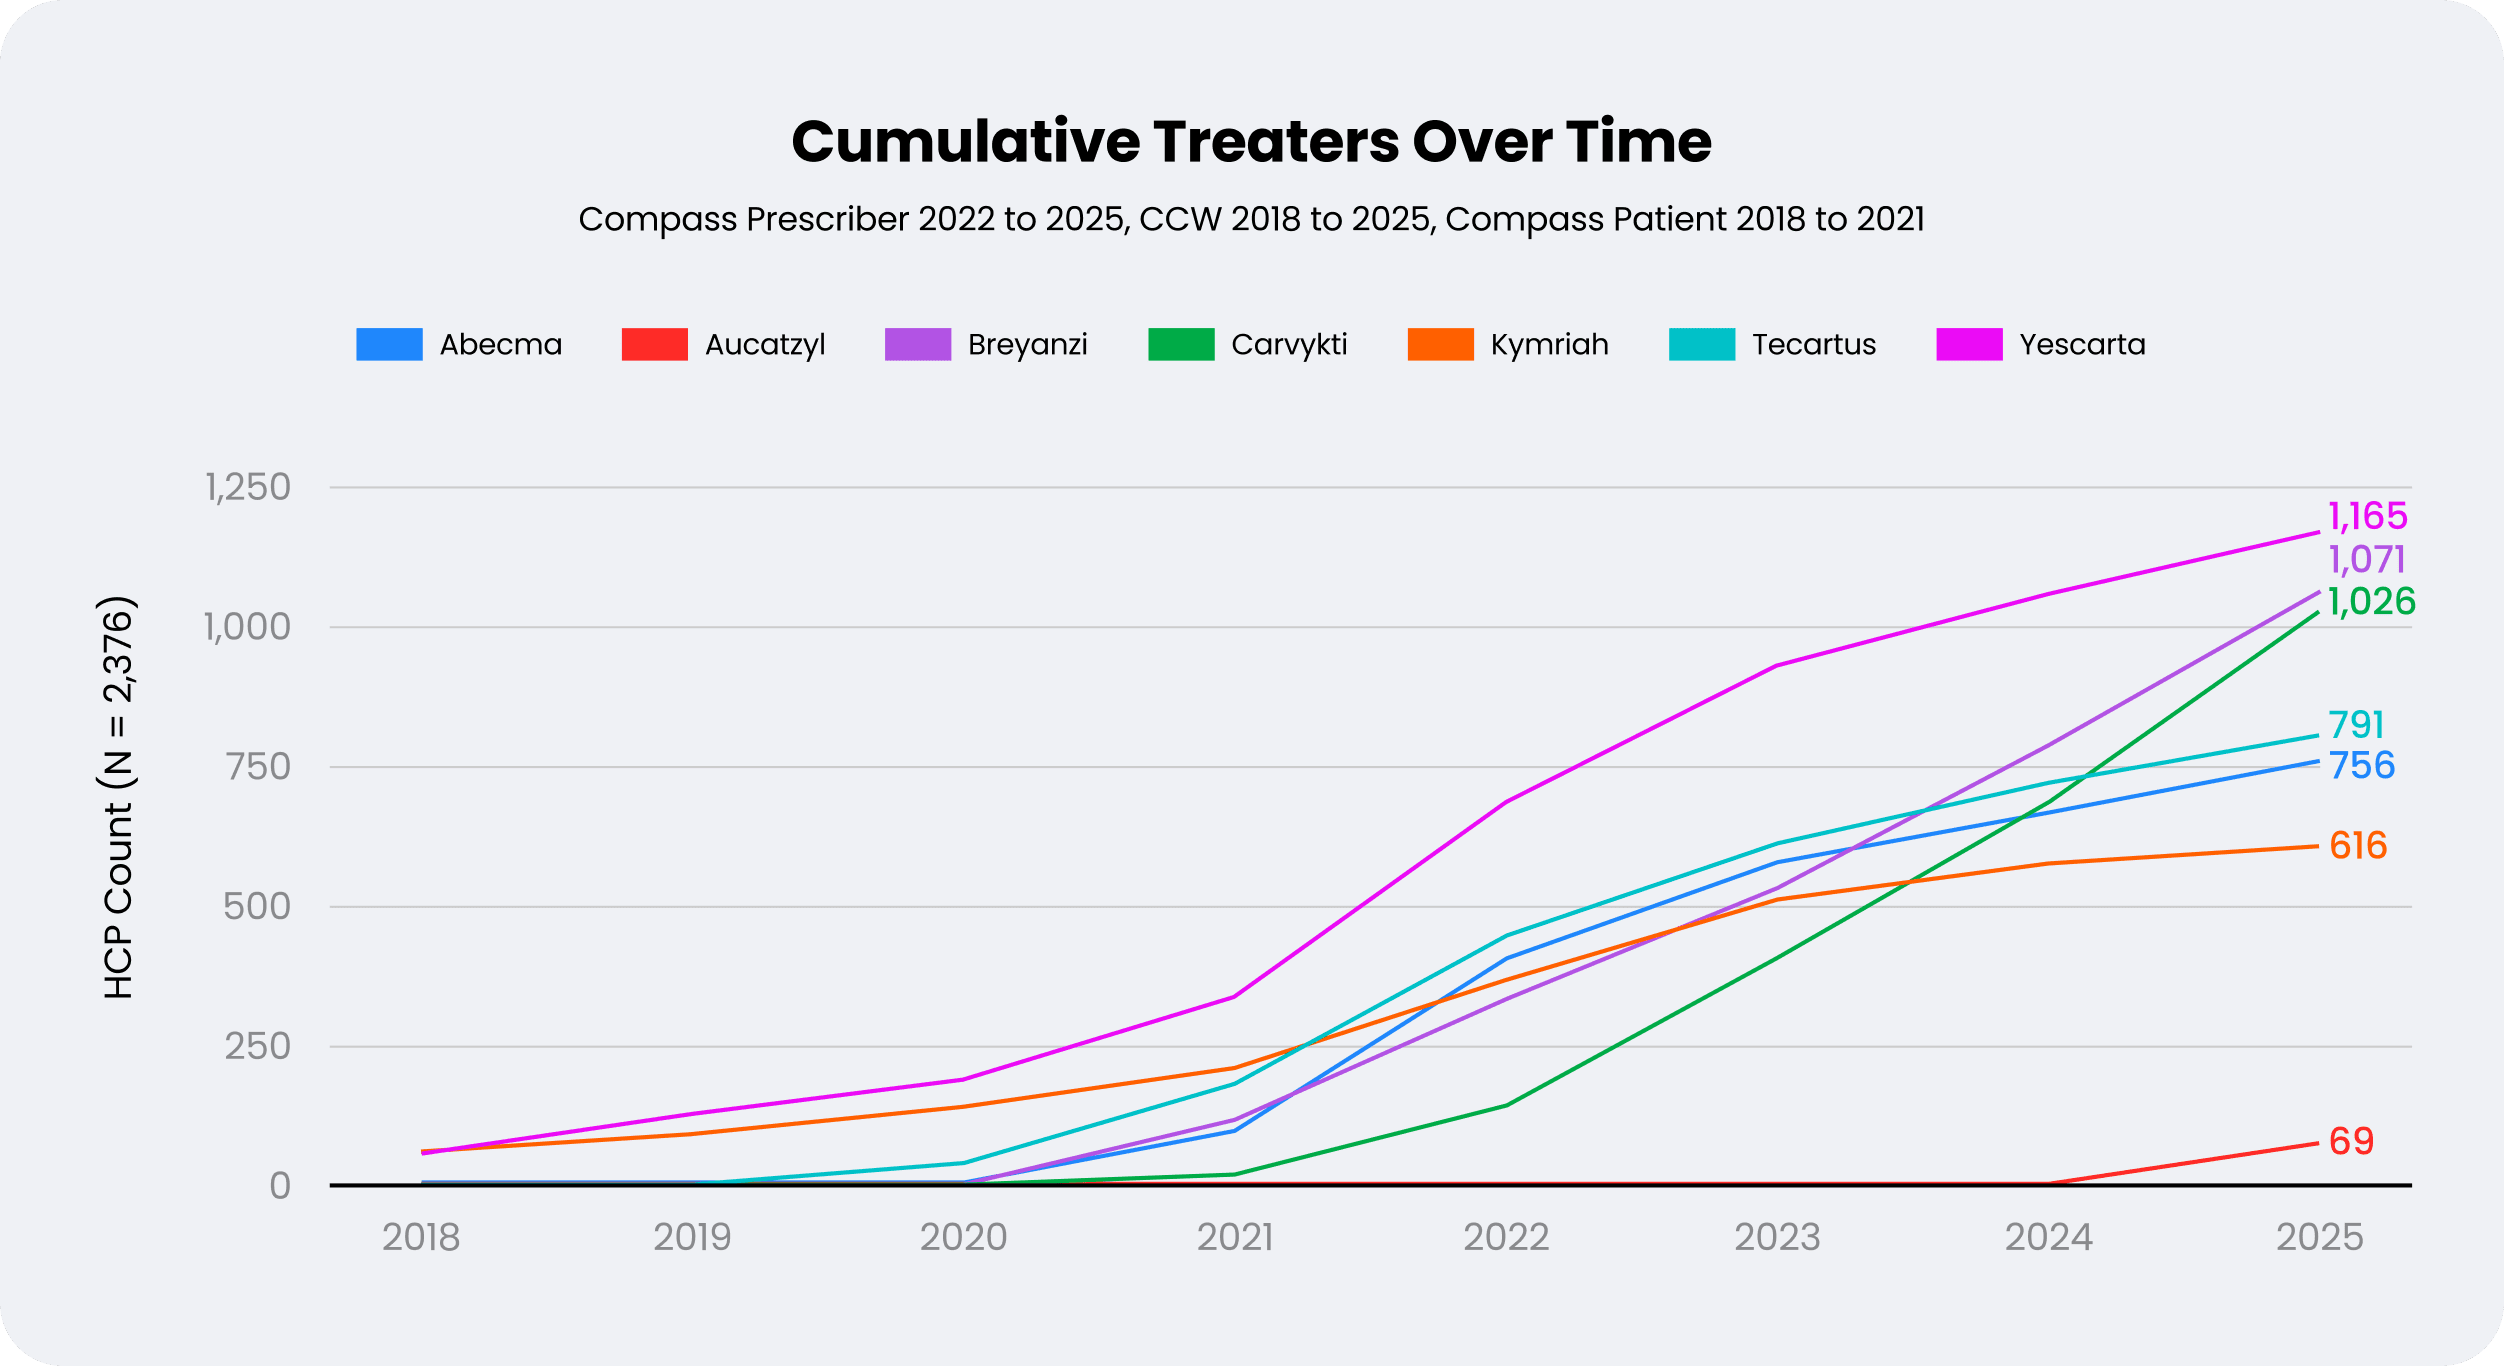
Over 2,300 different HCPs have treated patients with a CAR-T therapy since the first product approval in 2017. Over 1,000 HCPs have administered Yescarta, Breyanzi, or Carvykti, while over 700 have administered Tecartus and Yescarta.
CAR-T therapies have exhibited growth in terms of HCP count. Each year, HCPs that previously administered CAR-T therapies continue to utilize them while additional new HCPs begin treating patients for the first time. Following the 2018 to 2020 period of modest market adoption and regulatory uncertainty, each product exhibited sharp increases in new HCPs treating patients. From 2021 to 2022, for example, each CAR-T was utilized by over 200 new HCPs on average.
Breyanzi and Carvykti continue to show steep increases in HCP count. Each was utilized by over 300 new HCPs from 2024 to 2025. Despite being approved three years later than Yescarta, nearly as many HCPs have treated patients with Breyanzi and Carvykti as the second longest standing CAR-T therapy (Yescarta). The sharp growth of these products is in part driven by Breyanzi having five indications, the greatest number of indications among CAR-T therapies, and Carvykti treating the most common among all indicated conditions, Multiple Myeloma.
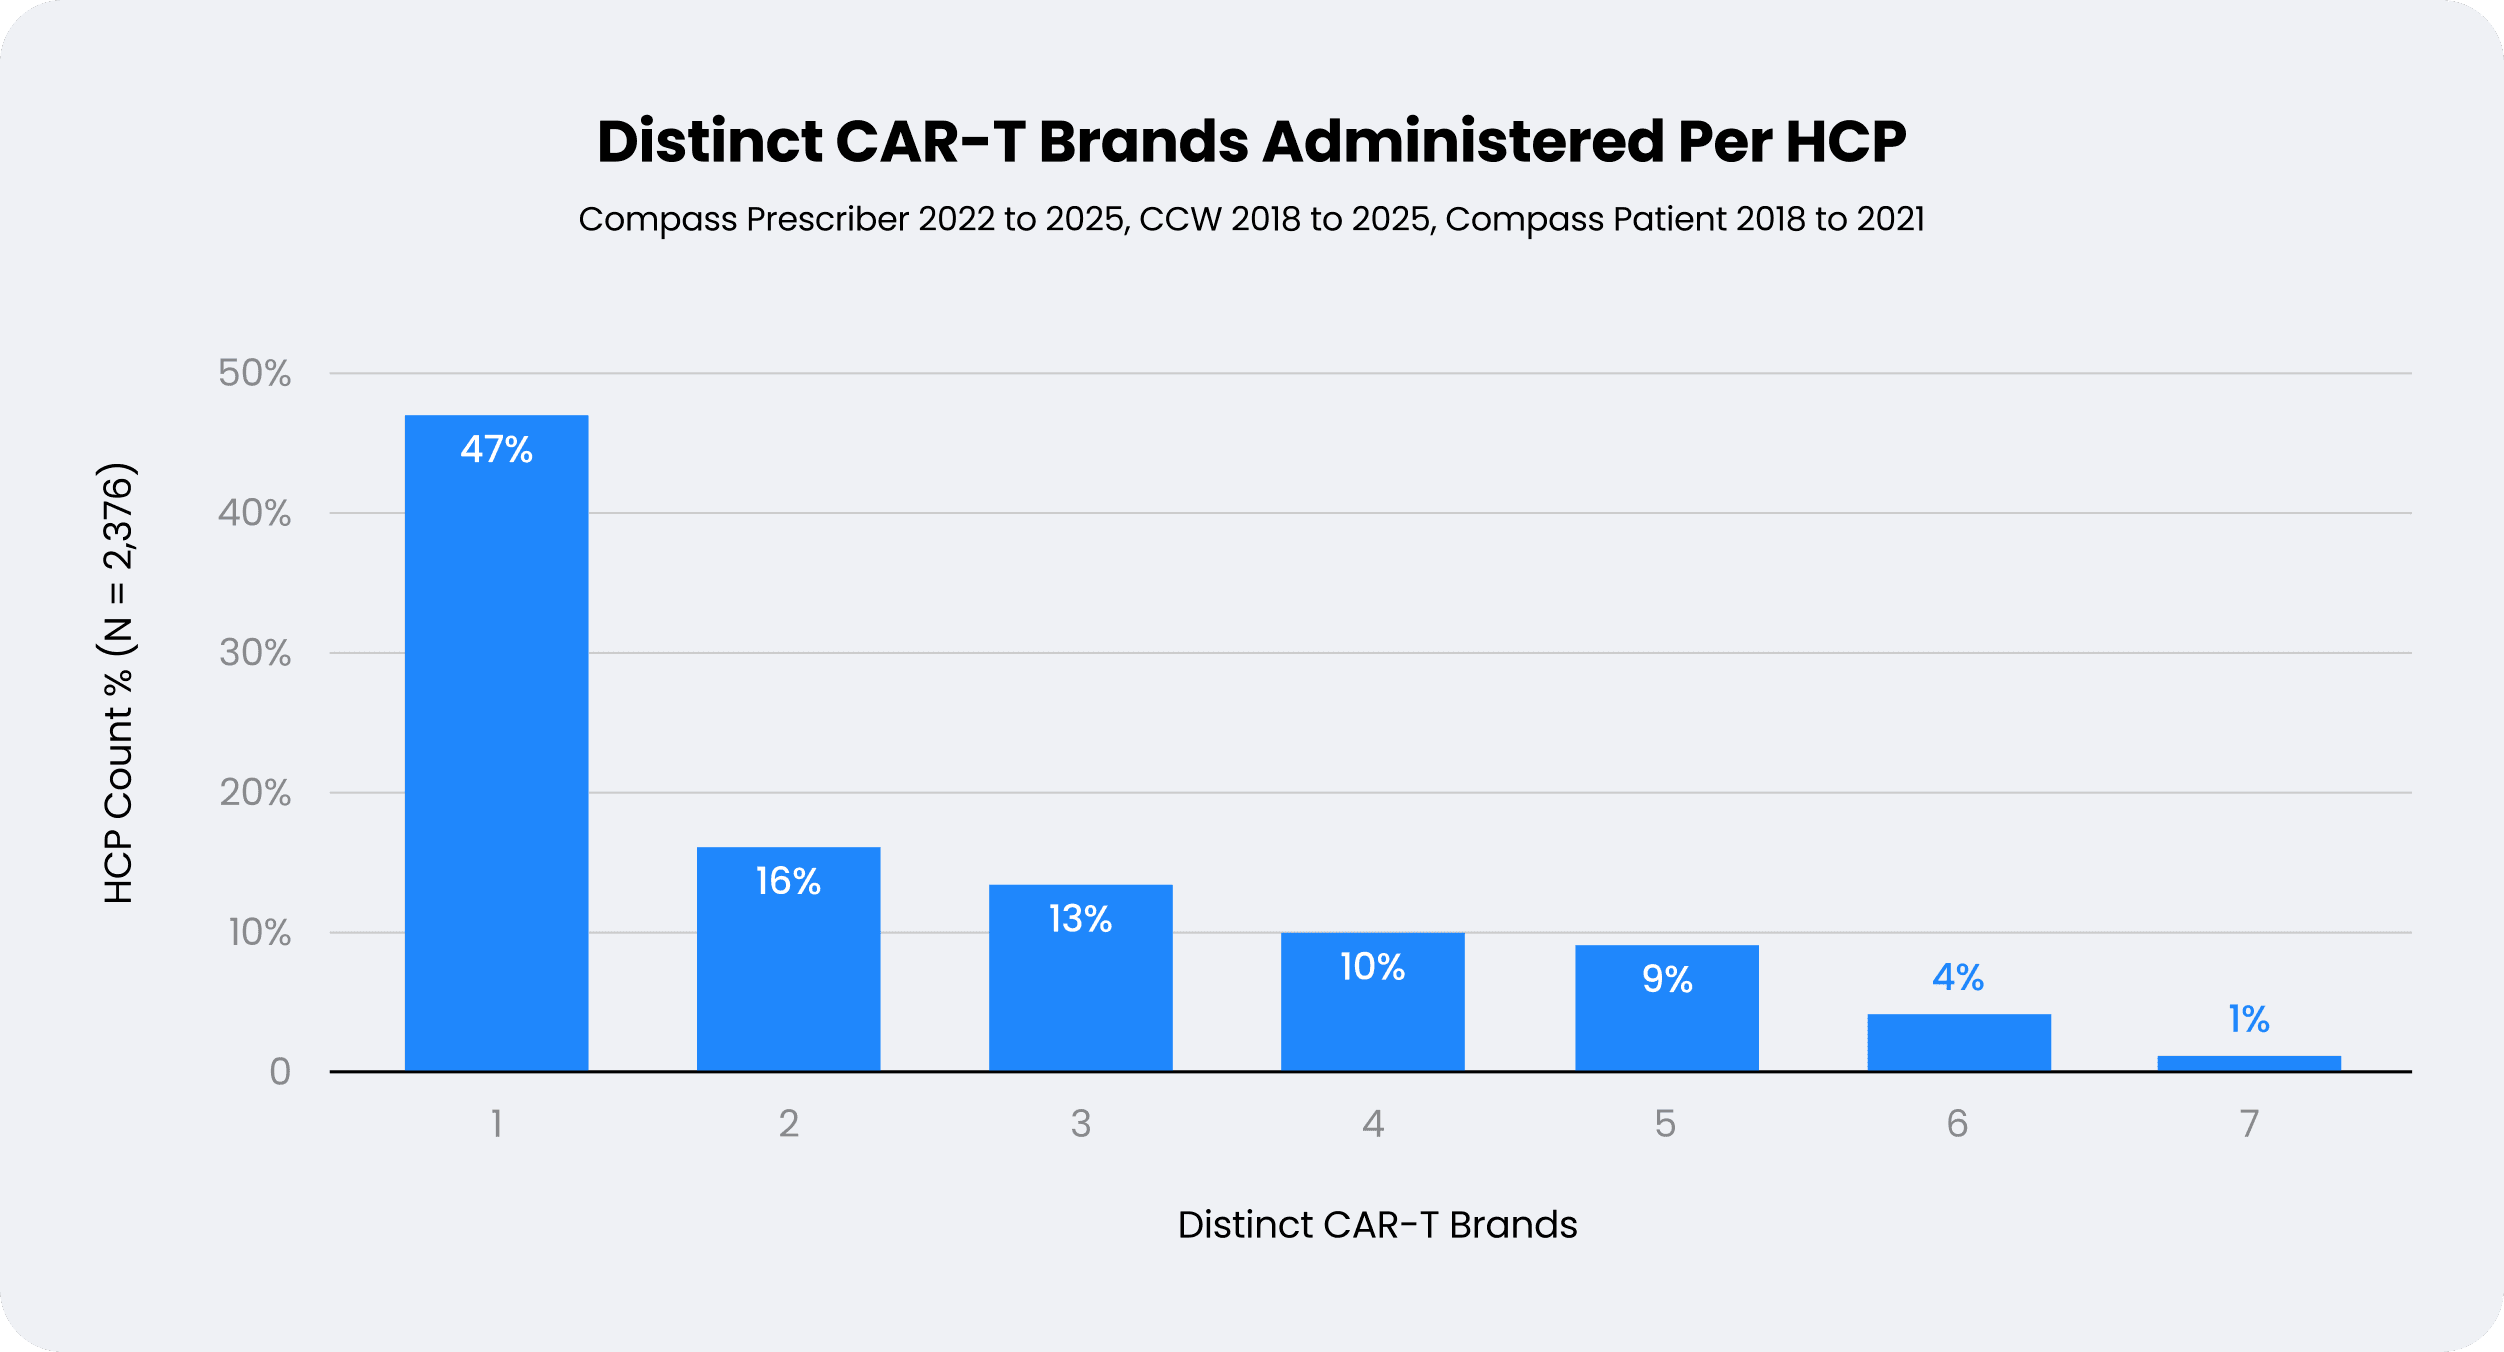
Interestingly, more than half of HCPs utilizing CAR-T products have administered multiple CAR-T brands. This suggests there is a core of HCPs with specialized, treatment-specific knowledge which allows them to treat patients with different conditions. In fact, 12 HCPs had administered each of the CAR-T therapies to patients, indicating deep expertise in the product class.
Additionally, it is the general case that the HCPs who administer multiple CAR-T brands also have higher utilization rates. For example, of the 1,300 CAR-T HCPs with Tx projections in Compass Prescriber, the rate of Tx per HCP for those who administered multiple brands was 29 Tx. That is over seven times the rate for HCPs who administered a single brand.
On a brand-by-brand basis, the predominant trend is a fraction of treaters, between 20% and 27%, exclusively administer the single CAR-T product. The one exception observed is for Kymriah. Nearly half of HCPs administering Kymriah exclusively utilize the single brand. This may point to additional specialization needed to administer Kymriah, possibly related to its pediatric indication. Overall, single product use creates a long tail of HCPs who may be in the orbit of care and administration but not necessarily the core decision-maker.
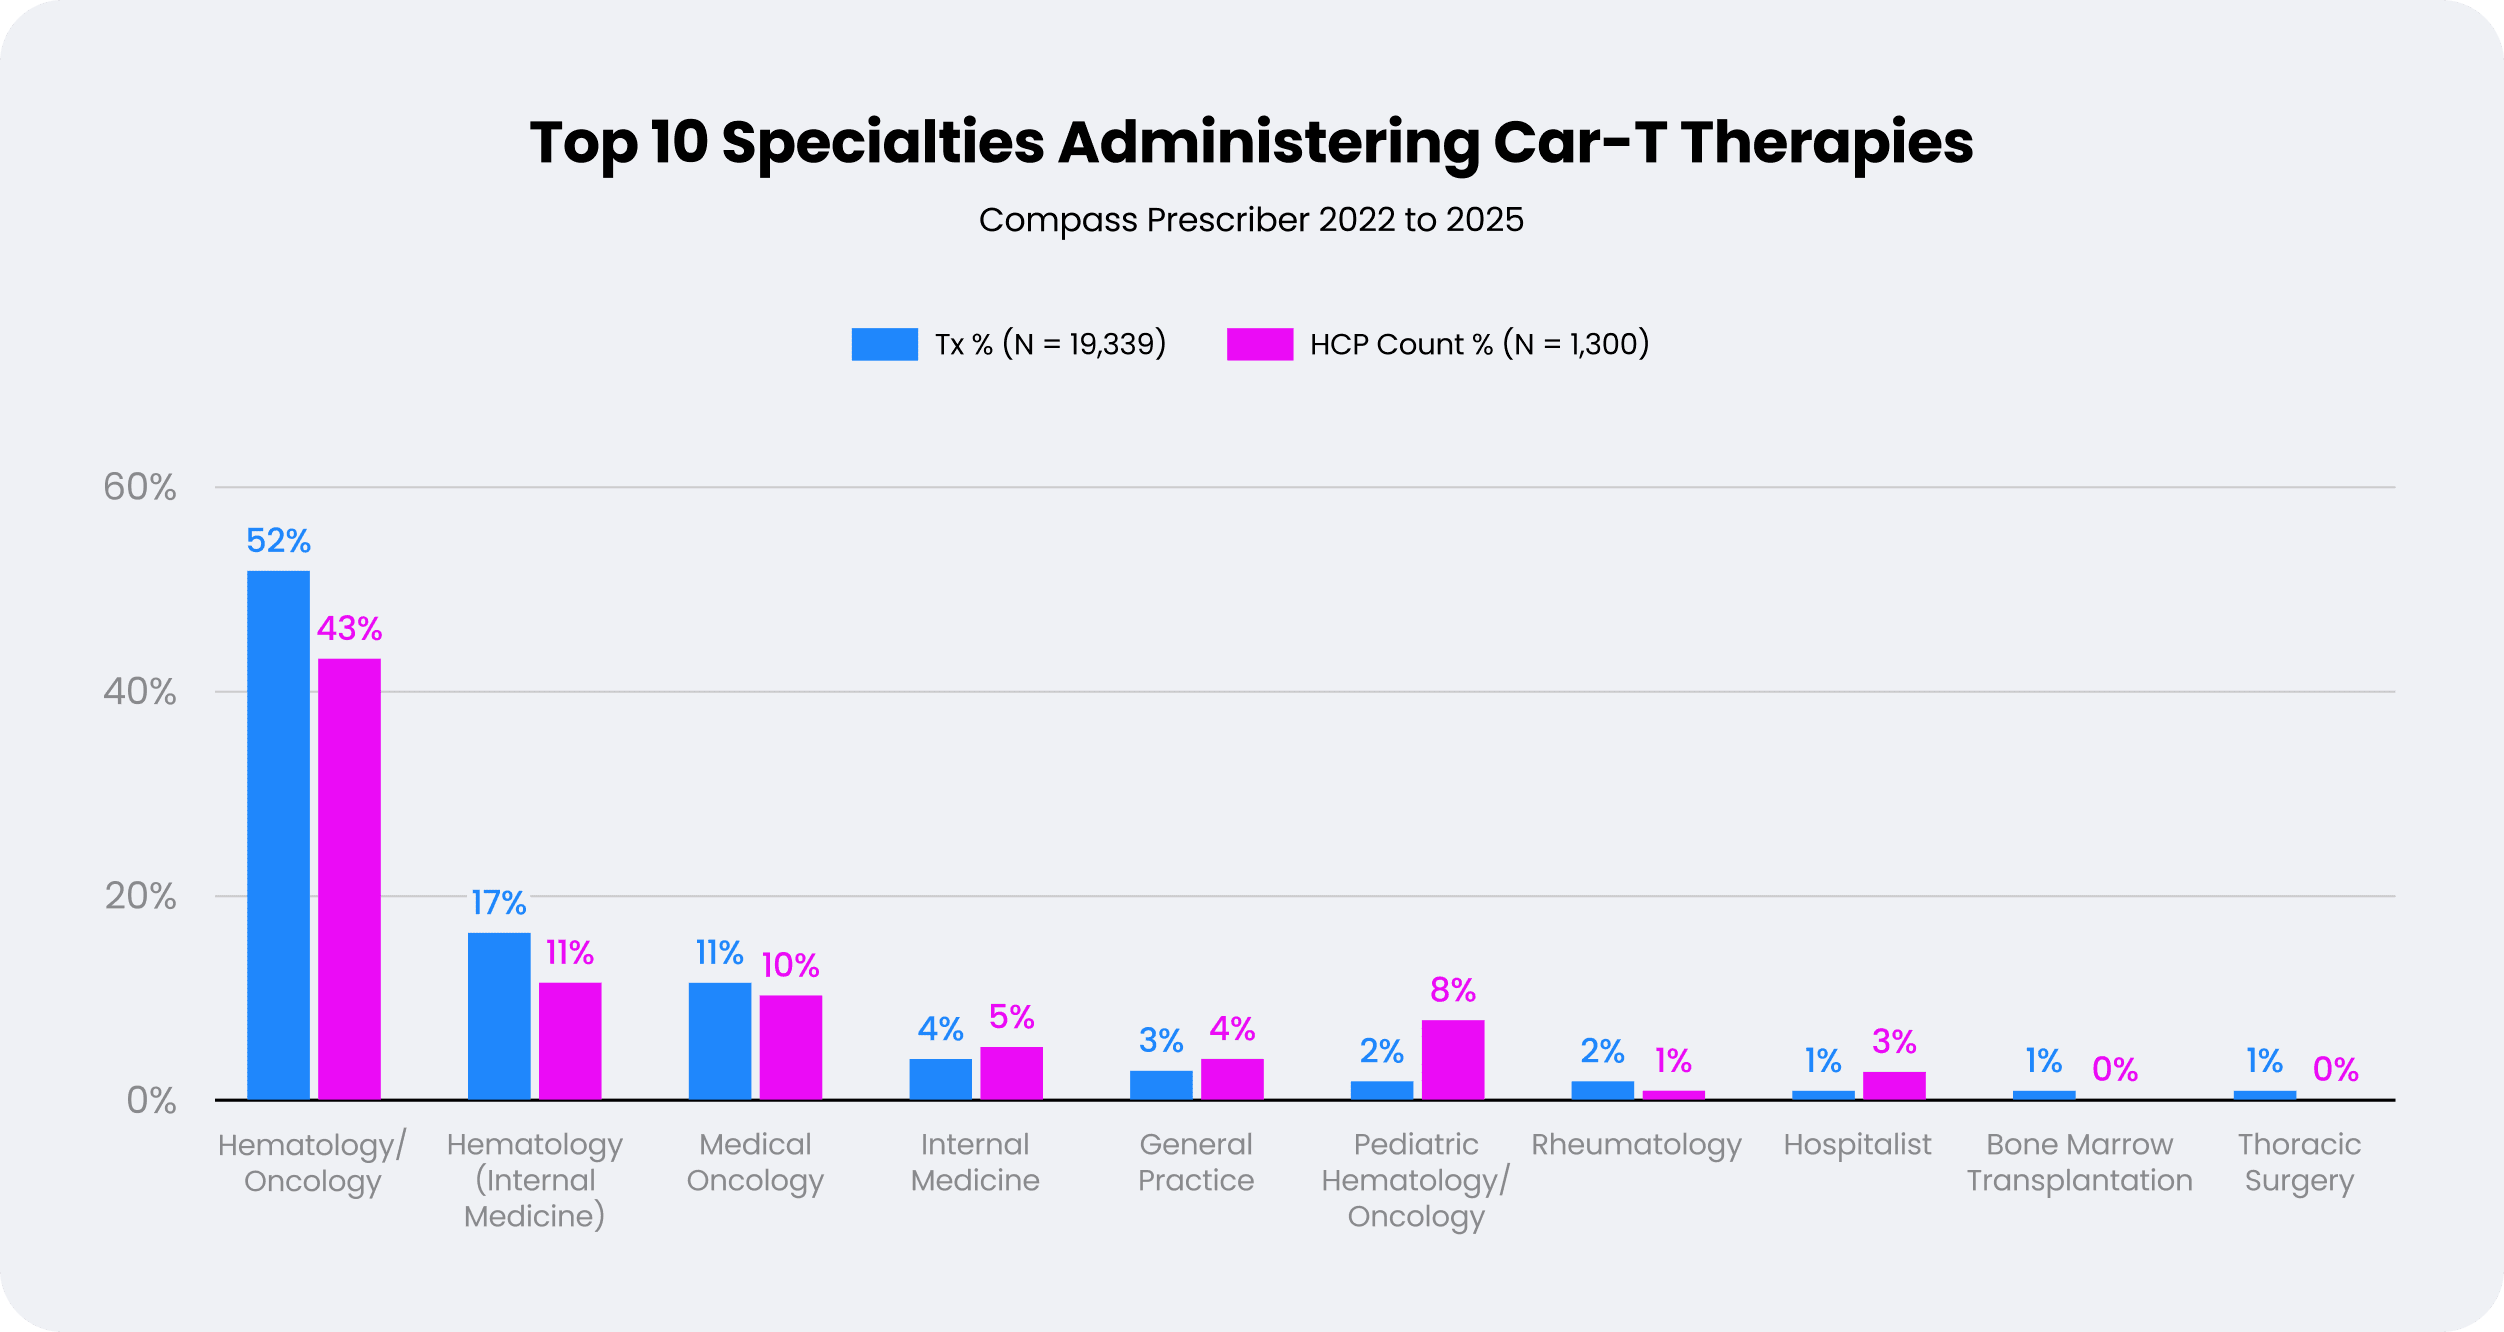
Findings related to specialty were consistent with expectations. Given primary indications related to blood cancers, Hematology and Oncology specialties were 72% of the HCP count and 83% of the Tx total. One outlying observation relates to the Pediatric Hematology/Oncology treaters. This specialty's share of Tx was less than its share of HCPs, unlike other Hematology/Oncology specialties. This is consistent with the greater proportion of single-treaters observed for Kymriah, which comprises utilization for this specialty. Unexpected specialties may point to inconsistency in how HCPs are indicated on claims and capture of an administering HCP rather than the decision-maker.
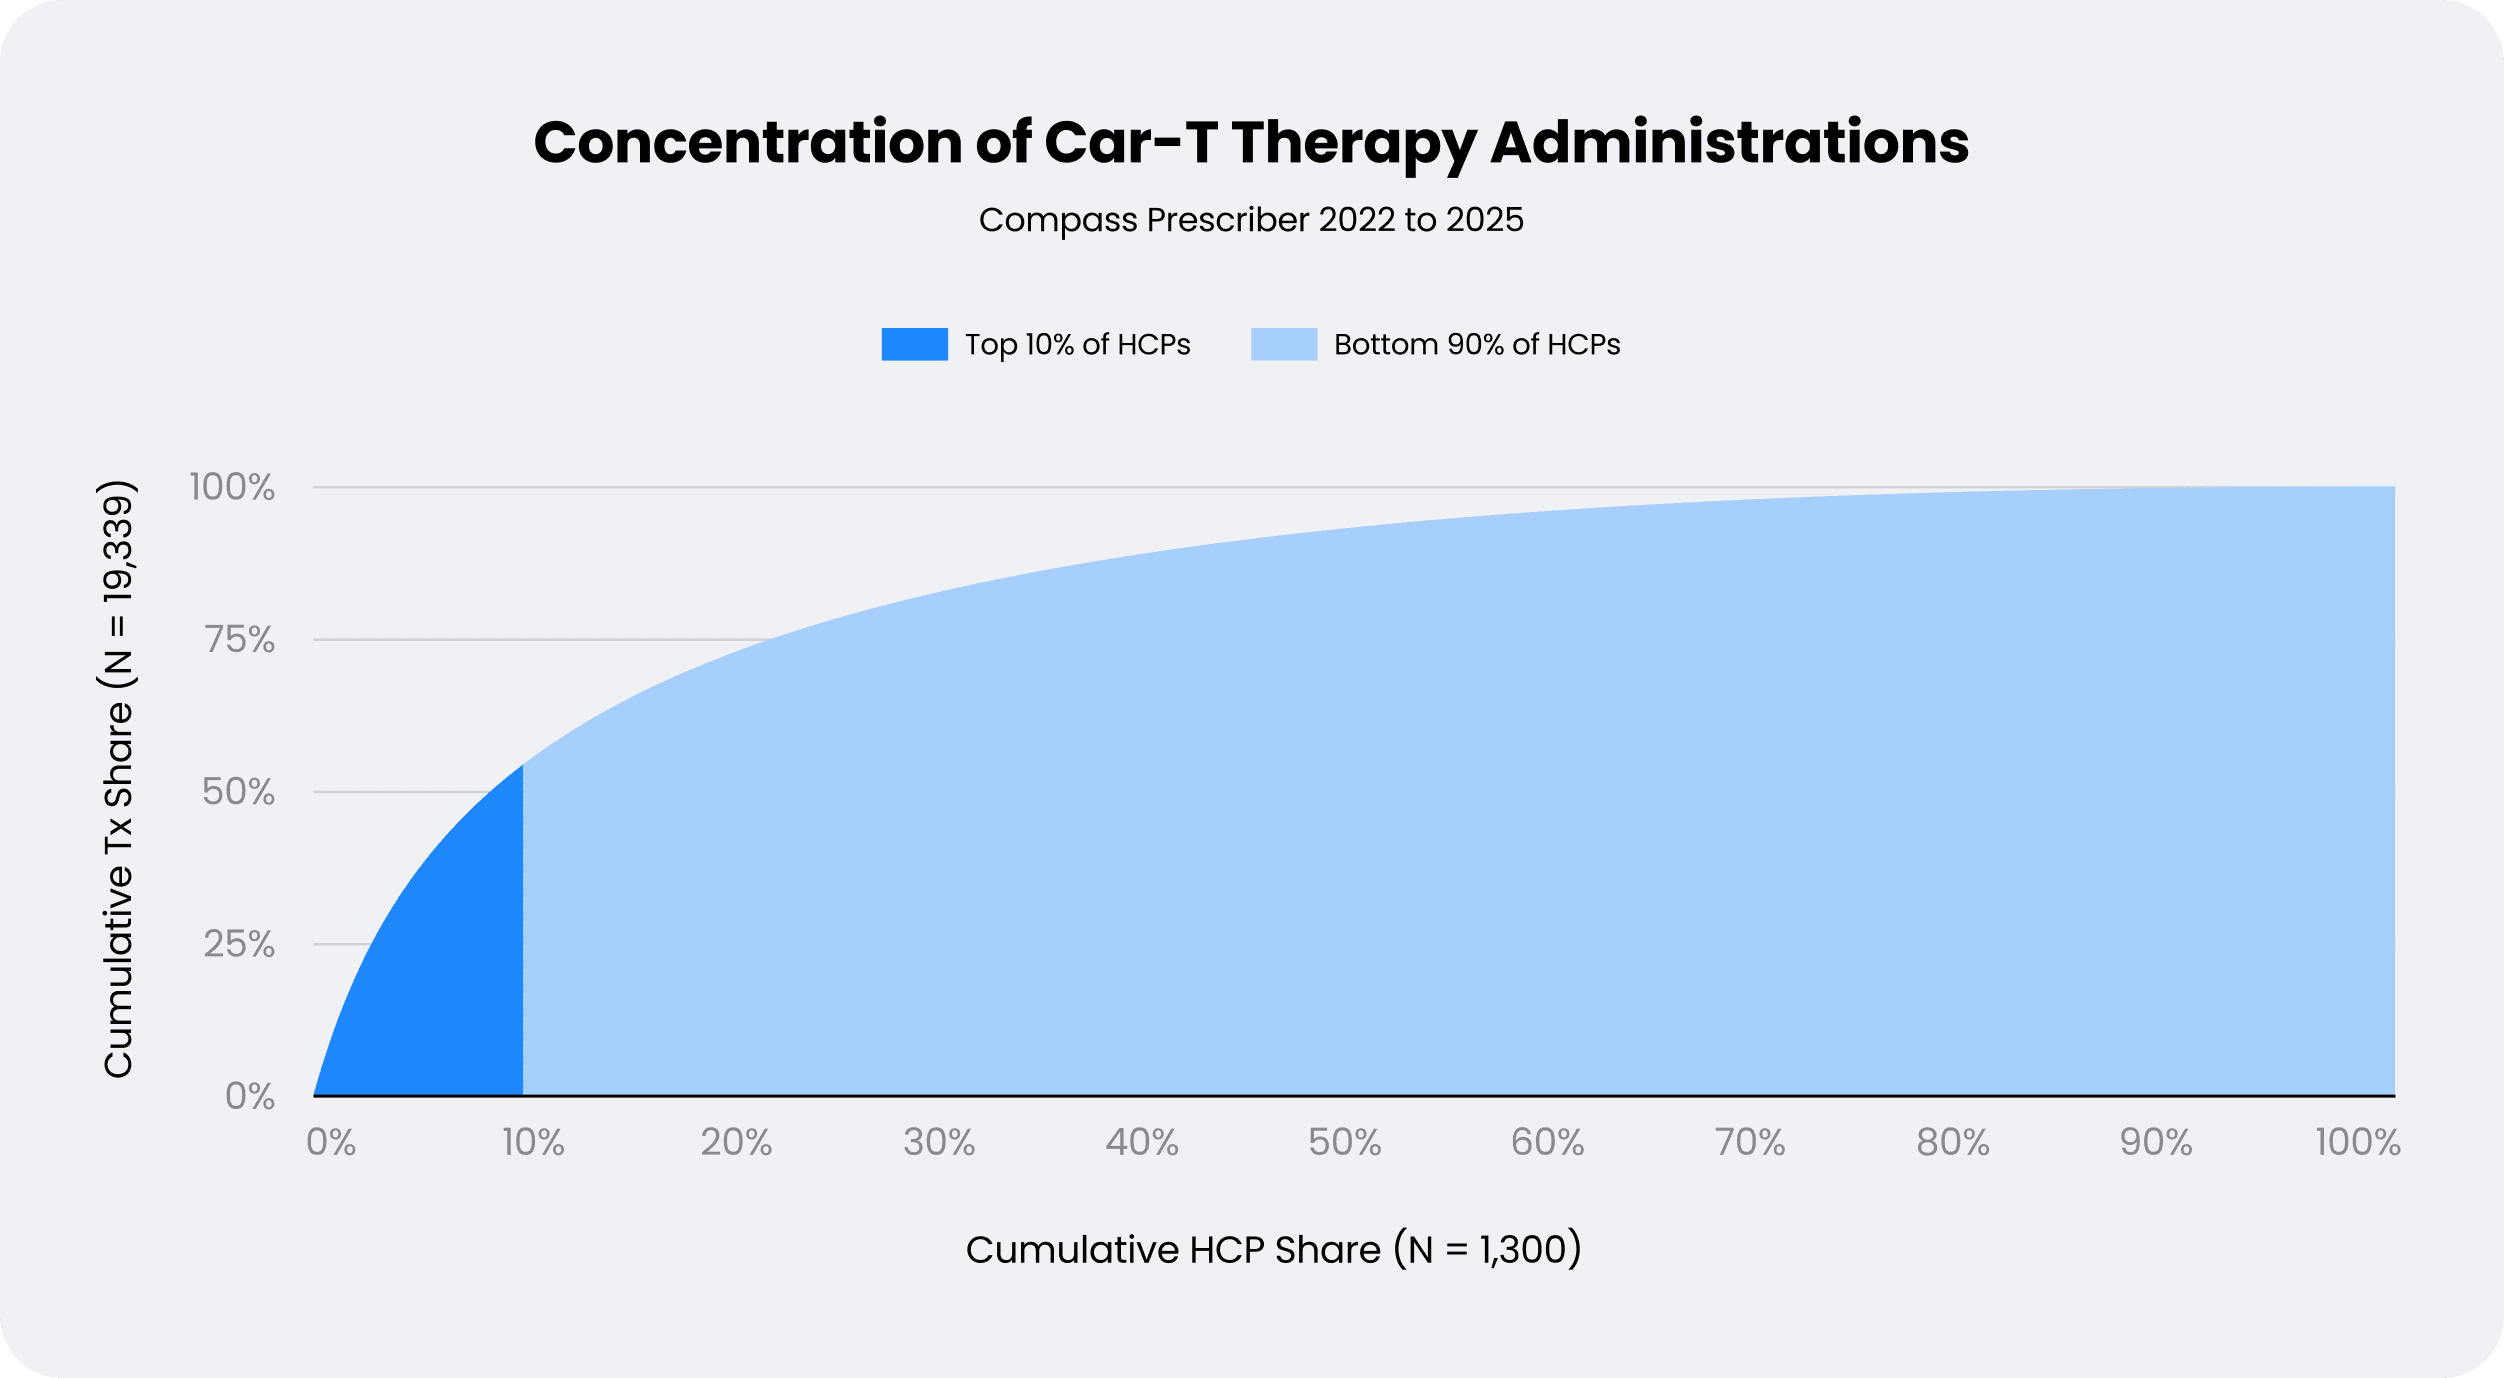
Overall utilization of CAR-T therapies is heavily concentrated in the top treating HCPs. The 130 highest-utilizing HCPs — the top 10% — were responsible for 53% of projected CAR-T volume from 2022 to 2025. These HCPs averaged 85 treatments each, ranging from a low of 44 to a high of 343 over the four year period. Given the level of expertise required to administer these complex therapies, it appears that a core of highly specialized HCPs are driving utilization.
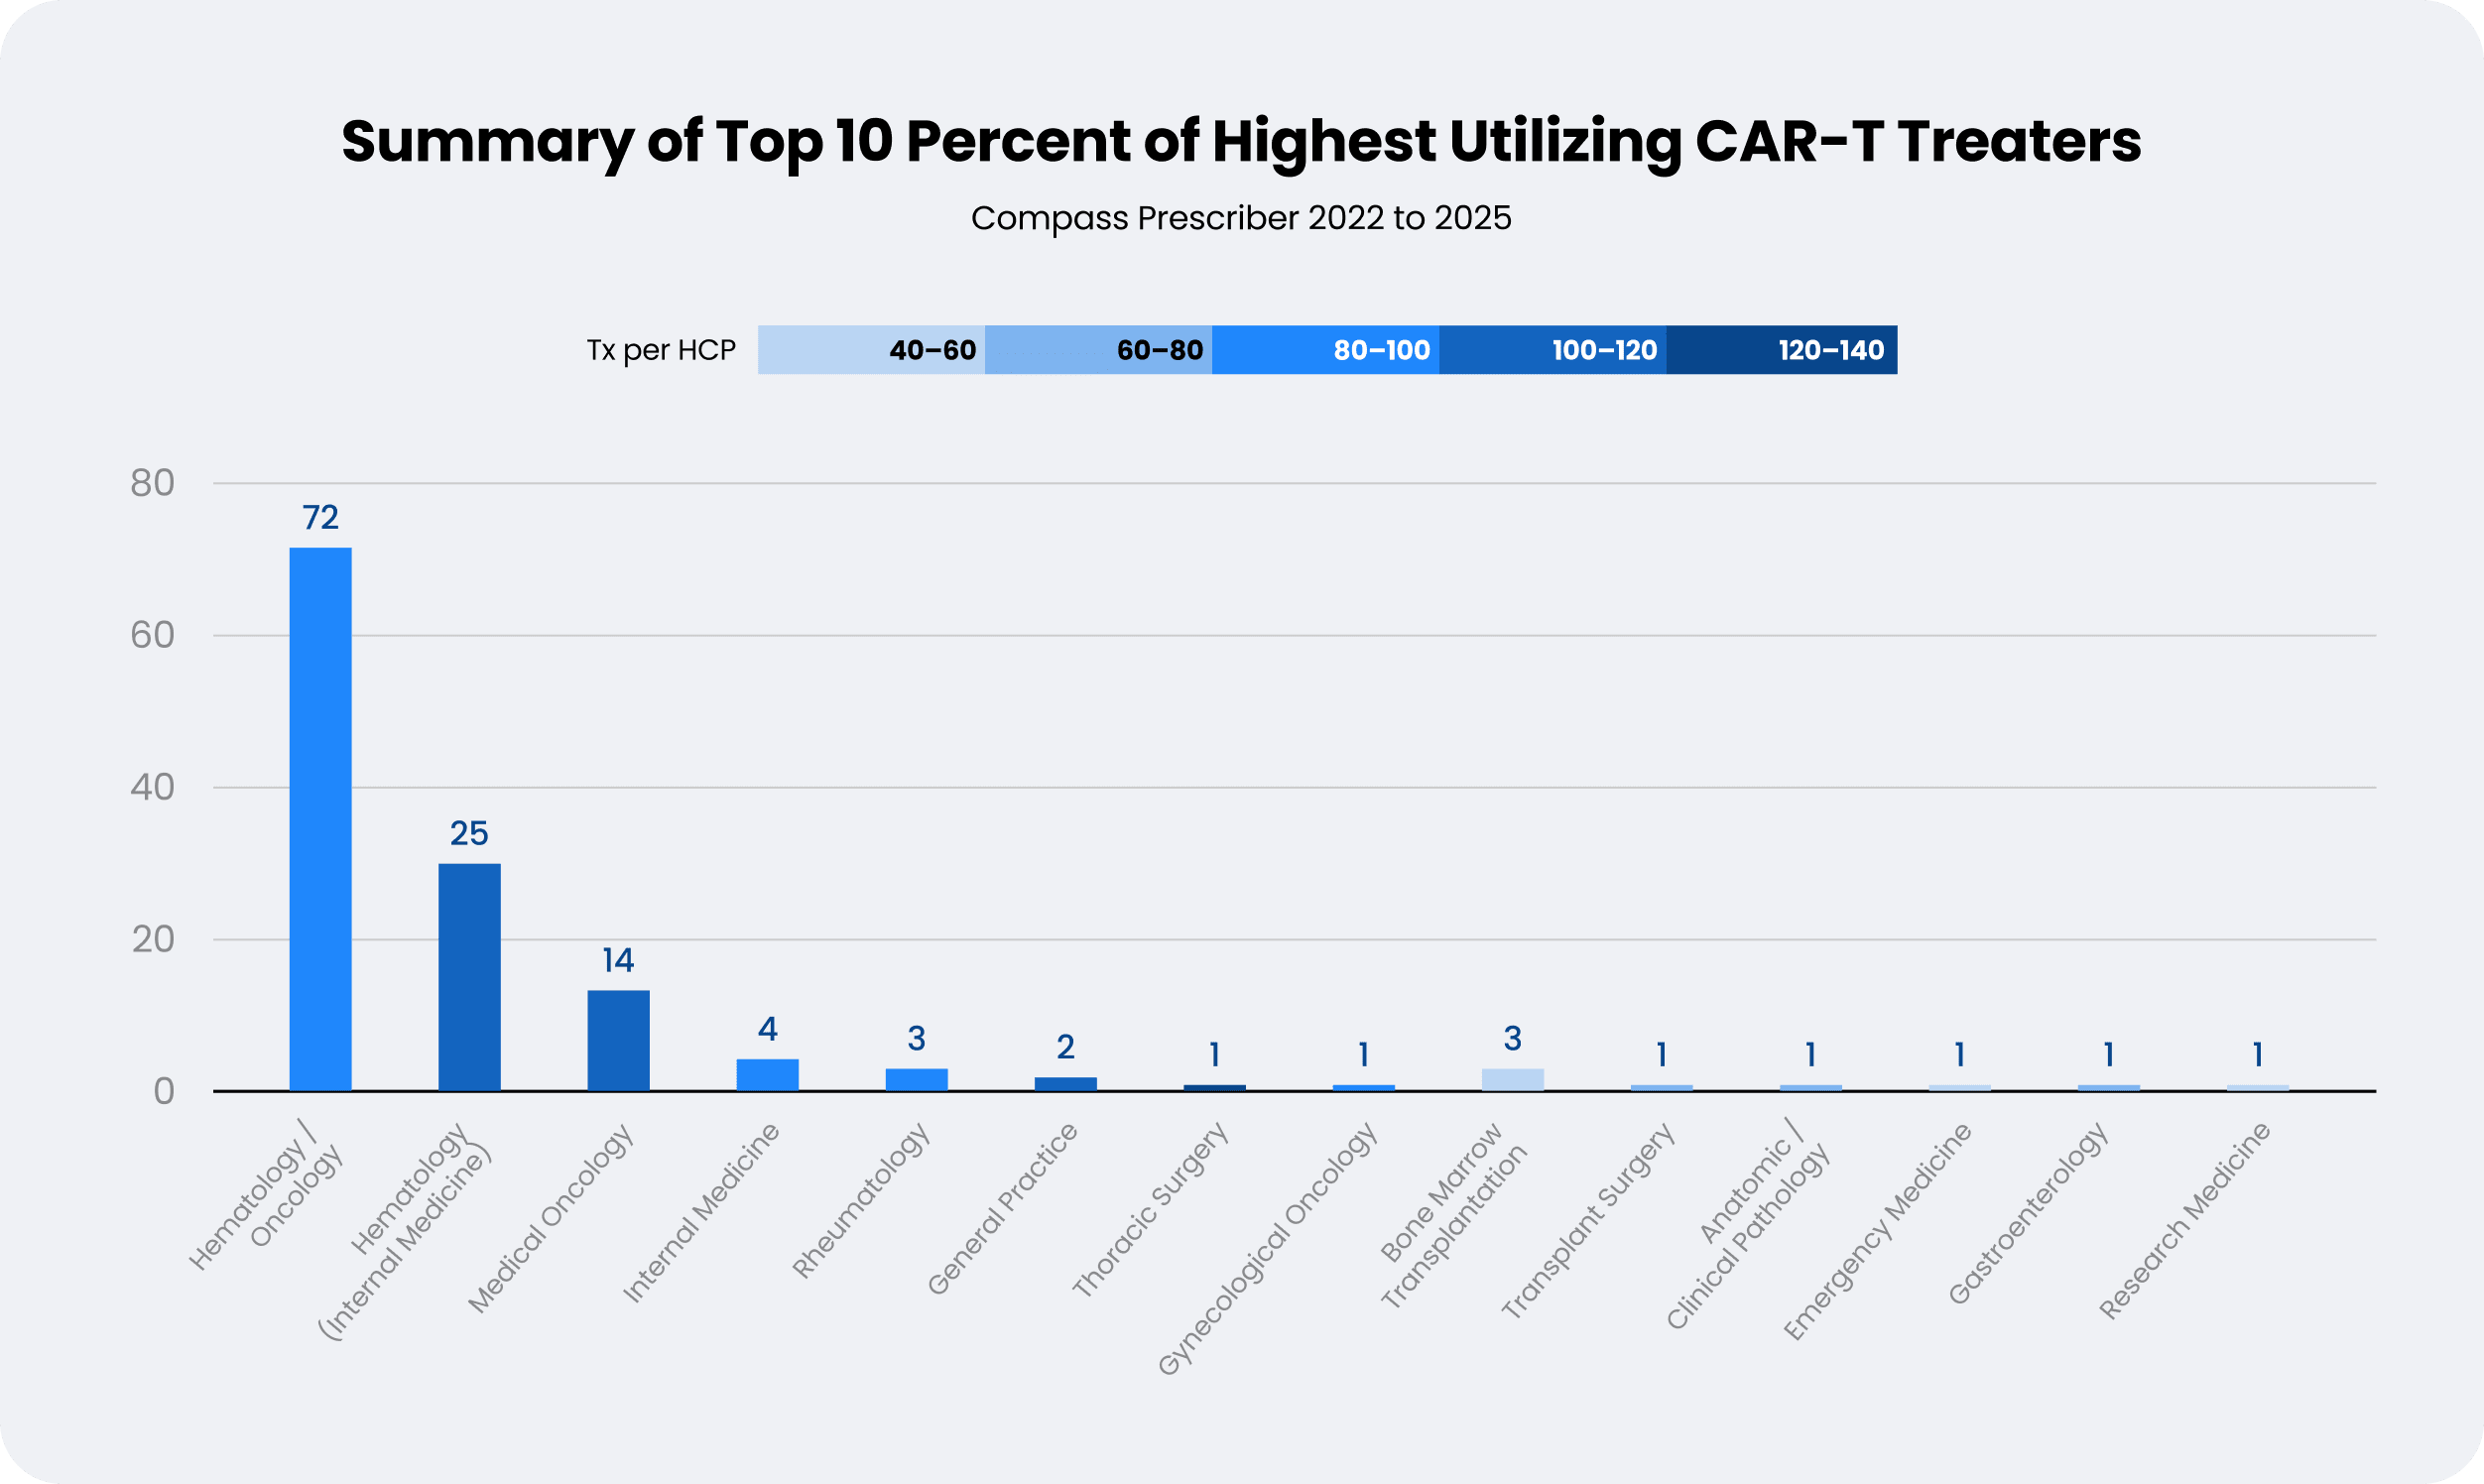
Double-clicking on the 130 HCPs shows their specialties to mirror the broader group, skewing towards Hematology and Oncology. Among the high-utilizing core, however, are unexpected specialties such as Thoracic Surgery, Bone Marrow Transplantation, and Gastroenterology. The unexpected physician specialties among the high-utilizing subset may speak to some of the difficulties in attributing CAR-T procedures which involve extensive care teams, different hospital departments, and take place over extended periods of time. While most patients (93%) have a single administration on a single day, the remaining spread two or three administrations over a few weeks or, in very rare cases, years.
Conclusion
The trajectory of the CAR-T landscape highlights a shift from slow early use to an established and growing specialty market. The multi-year lag between the initial approvals of Kymriah and Yescarta and their cross-market adoption reflected a healthcare system grappling with a new therapeutic paradigm. Early market barriers dissolved as clinical successes, expanded indications, and the landmark 2019 CMS National Coverage Determination established a commercial path forward.
The analysis shows a market pivot occurring between 2021 and 2022. This inflection point, characterized by a large spike in annual patient volume, marked CAR-T's evolution from an experimental last resort to a second- or third-line specialized hematologic oncology. The clinical uptake seen in subsequent launches like Carvykti, Breyanzi, Tecartus, and Abecma showed that the bottlenecks defining early-generation therapies have been drastically reduced. This shift has cleared the way for a highly concentrated, specialized network of healthcare providers, who drive the bulk of CAR-T patient treatment.
CAR-Ts have become a cornerstone of treatment for advanced oncology care. The ability to understand and track their utilization will be a critical commercial input and operational dependency. The challenges will continue to exist, so the right data strategy, sources, and methodologies are essential for successful commercialization.
Learn more about projected prescription and procedure data with Veeva Compass.