Veeva Agentic Commercial Trends Report
As the life sciences industry continues to advance HCP relationship management, omnichannel orchestration, and AI initiatives, it’s critical to stay on top of evolving engagement trends.
Each quarter, the Veeva Agentic Commercial Trends Report provides unique insights into global and regional HCP engagement trends based on an analysis of approximately 600 million HCP interactions across more than 80% of biopharmas worldwide.
Reach out to Veeva Business Consulting to learn how connected sales, marketing, and medical teams deliver a better customer experience.
Veeva Agentic Commercial Trends Report Q1 2026
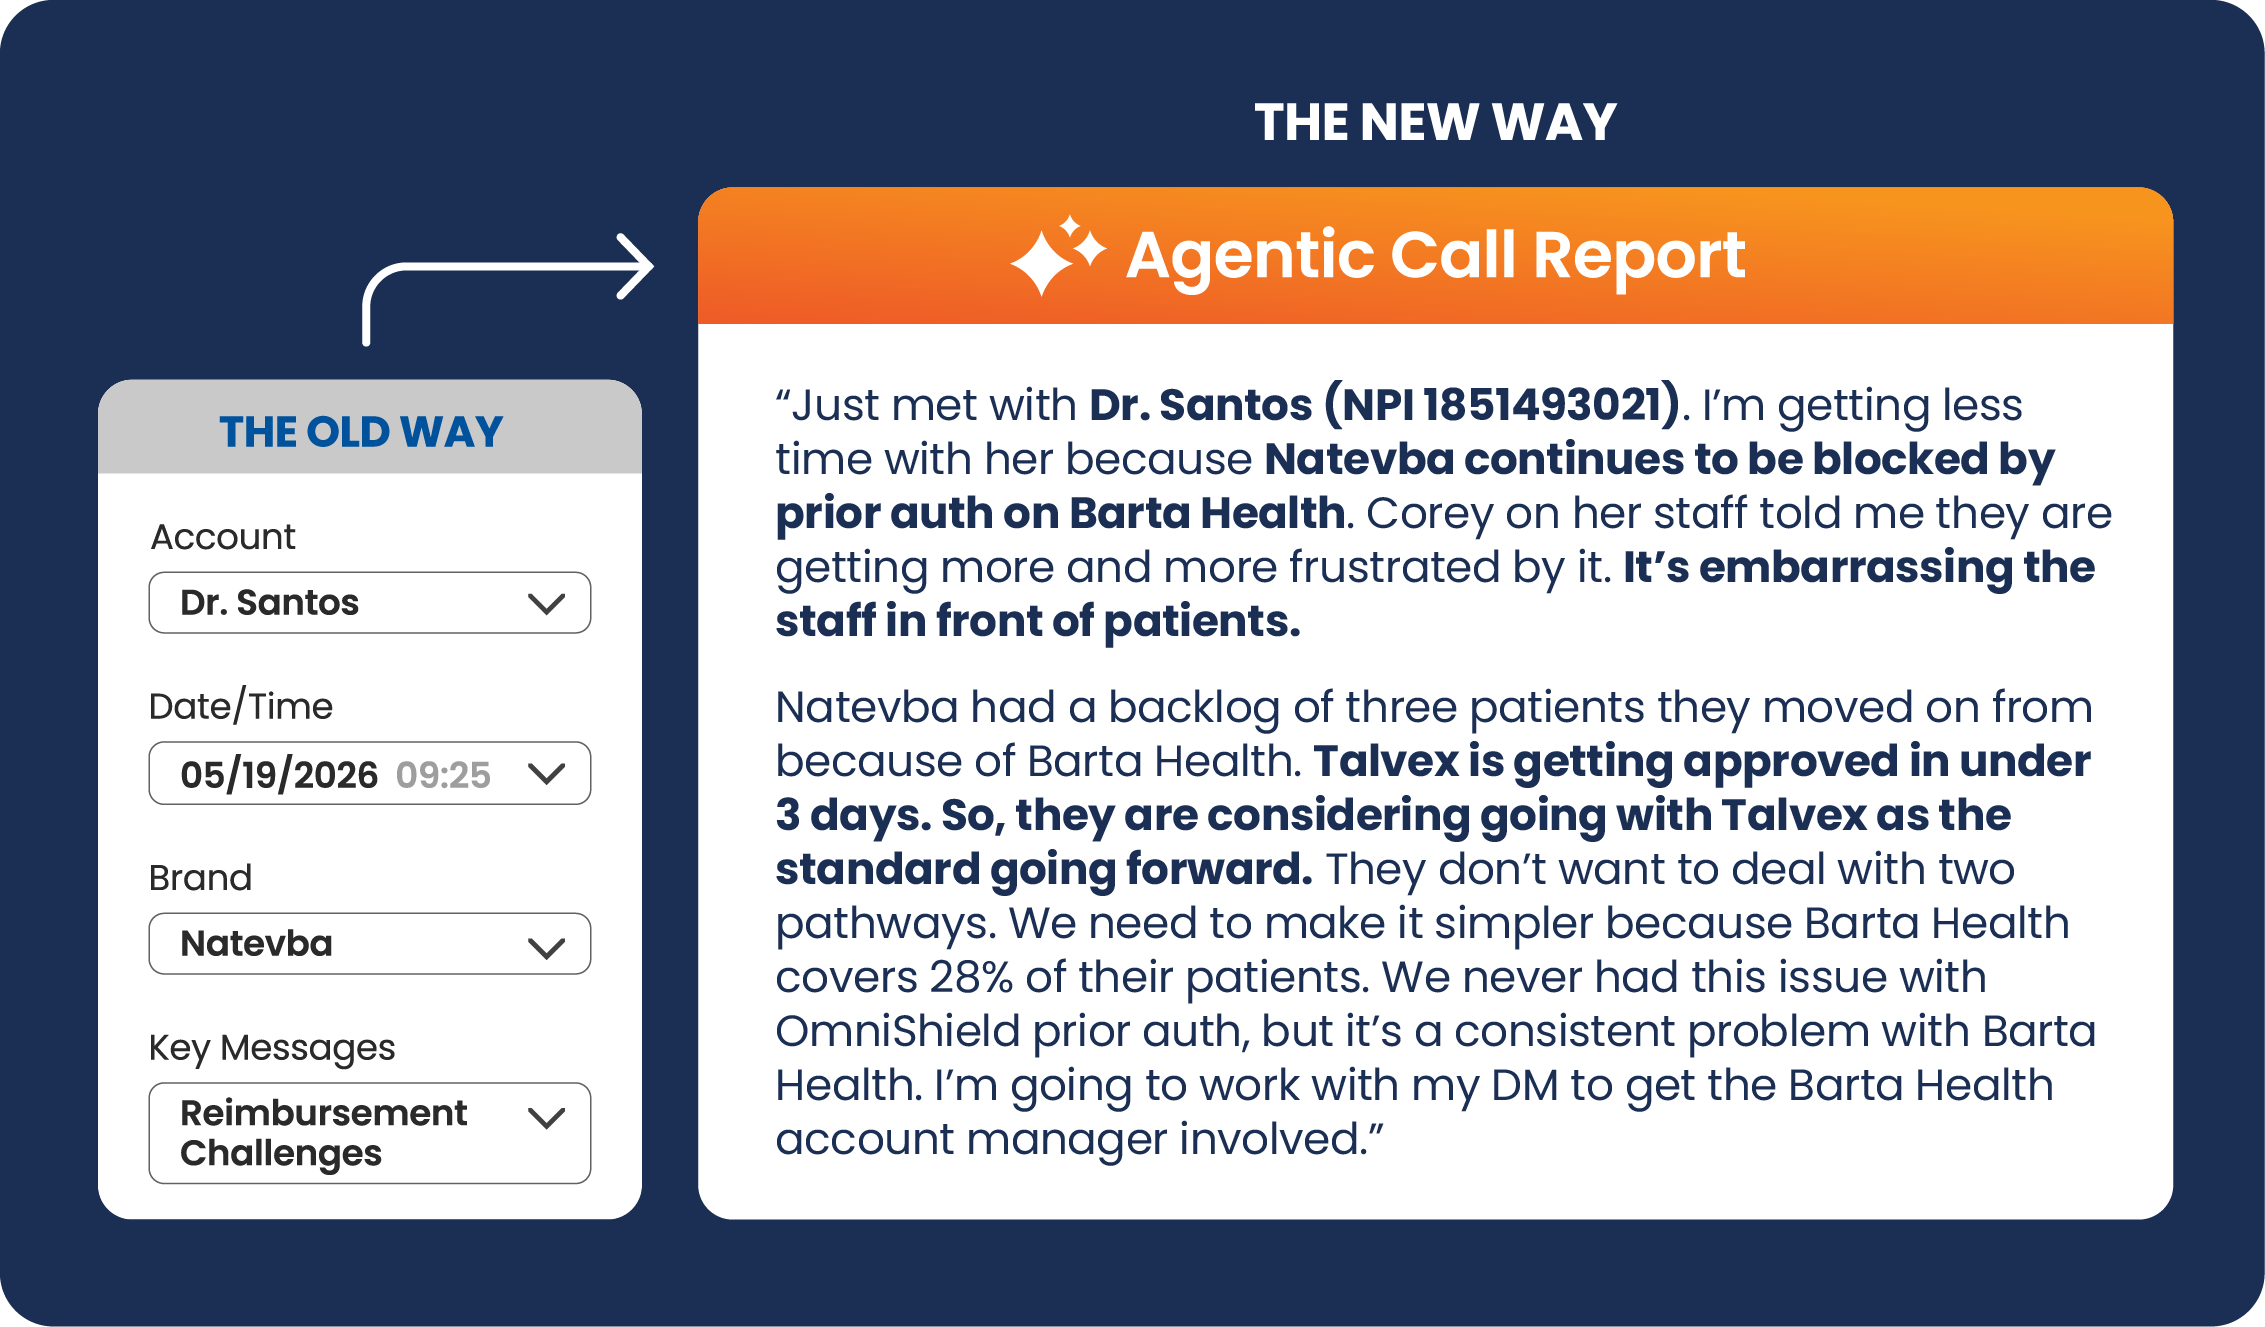
65% of Agentic Call Reports Reveal Actionable Treatment Barriers
The Q1 2026 Agentic Commercial Trends Report focuses on how agentic commercial capabilities – Agentic Call Report and conversational AI – generate Commercial Evidence that drives precise engagement, enables patients and HCPs to make informed treatment decisions, and yields a measurable return on AI (ROAI).
Agentic Call Report identifies treatment barriers
Agentic Call Report captures rich, unstructured data and verbal summaries that uncover barriers to treatment adoption in 65% of field interactions. This actionable intelligence allows field teams to directly address treatment barriers with speed and precision.
Conversational AI optimizes content strategies and informs field insights
Conversational AI provides answers and resources at the moment of need, while giving brands visibility into what HCPs and patients are asking for. These insights translate to a clear ROAI and help close gaps in content and customer journeys.
Precision and personalization to deliver ROAI
Engagement models will evolve as field roles leverage Commercial Evidence. Field teams will be equipped to act on HCP insights with greater precision, content will be optimized to drive key next actions, and event strategies will address precise scientific questions.
Read the report to learn the most effective uses of Commercial Evidence in commercial biopharma.
Read previous trend reports
65% of Agentic Call Reports Reveal Actionable Treatment Barriers
Read Q1 2026 report on Commercial Evidence delivering unseen HCP and patient insights

AI Initiatives with the Most Impact on HCP Relationships and Patient Treatment
Read Q4 2025 report on meeting HCP and patient needs using AI

Free Text Uncovers Missing HCP Engagement Insights
Read Q3 2025 report on the AI capturing nuance in HCP engagements

Set Shared Medical-Commercial Goals to Accelerate Treatment
Read Q2 2025 report on measuring and rewarding collaboration