Industry Report
Veeva HCP 360 Trends Report
Free Text Uncovers the HCP Engagement Insights Biopharma Is Missing
Deep, contextual primary engagement data is a requirement to advance relationship management and omnichannel orchestration
As the primary engagement channel, field teams are the most direct and expensive way to build relationships with healthcare professionals (HCPs). Yet most companies miss the deep insights from their most valued engagement channel by using structured drop-down values to record meeting notes, mainly because of legacy compliance concerns.
Relying on generic meeting notes joined with third-party data, such as prescription data, does nothing to advance relationship management, omnichannel orchestration, and AI initiatives in a differentiated way.
Detailed engagement data, captured through free text notes from the field, provides the context and texture needed to understand an HCP’s immediate needs and emerging treatment barriers. It’s also vital for connecting the dots across HCP engagements with sales, marketing, and medical teams, so each interaction informs the next.
As biopharmas invest heavily to drive more efficient and impactful engagements — through optimized pre-call planning and orchestrated omnichannel strategies, for example — building enriched primary engagement insights with free text will become foundational to success. With Veeva’s Free Text Agent, the field force can capture the rich context of conversations within an organization’s compliance guardrails by monitoring free text in real-time.
“We can permit field members to express themselves in their own vernacular, with the tools getting to a place where we benefit from unstructured compliant feedback.” Dale Cooke Regulatory attorney for life sciences and medical device companies
This report explores the important steps for adopting a business-driven approach to using compliant Free Text Agent and unlocking enriched engagement data as a differentiator.

Dan Rizzo
VP, Global Head of Business Consulting

Free text creates primary engagement insights for optimizing relationship management, omnichannel orchestration, and AI
When every organization can buy the same third-party data, the only true differentiator for strengthening relationships and orchestrating engagement is the quality and application of your primary engagement data.
Highly valuable engagement insights — such as the HCP’s true intent, sentiment regarding new data, unsolicited questions about off-label topics, or specific barriers to adoption — should be captured within rich, narrative free text. When field teams are forced to summarize a complex dialogue into a handful of predefined drop-down selections, nuance and connectivity is lost.
Most commercial organizations still do not allow for free text entry due to compliance concerns. The fear that a field team member might inadvertently document an unapproved claim or proprietary information is often enough for an organization to default to a restrictive, lowest-common-denominator data capture policy. As a result, we lose important detail and limit the efficacy of high-value investments in AI designed to orchestrate engagement across functions and roles.
Effectively capturing and using this deep, contextual data is the foundation for an engagement model that is connected, personalized, and truly orchestrated across sales, marketing, and medical teams.
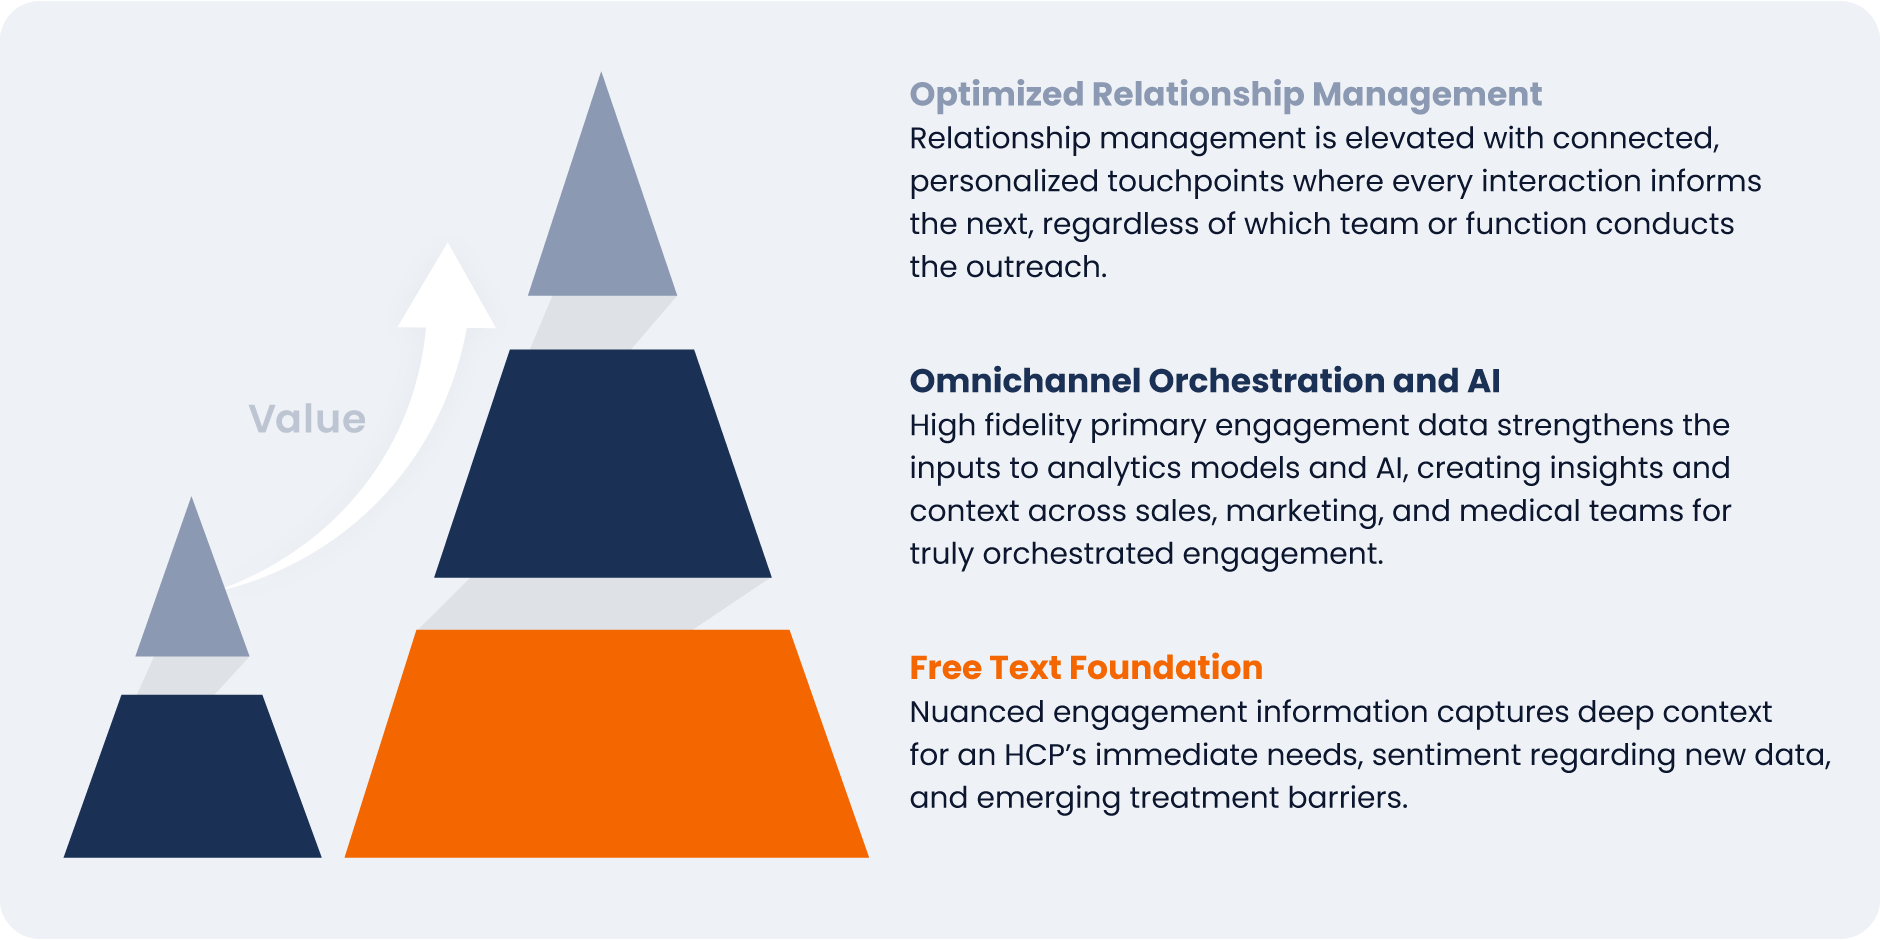
Compliant Free Text Agent helps unlock rich engagement data
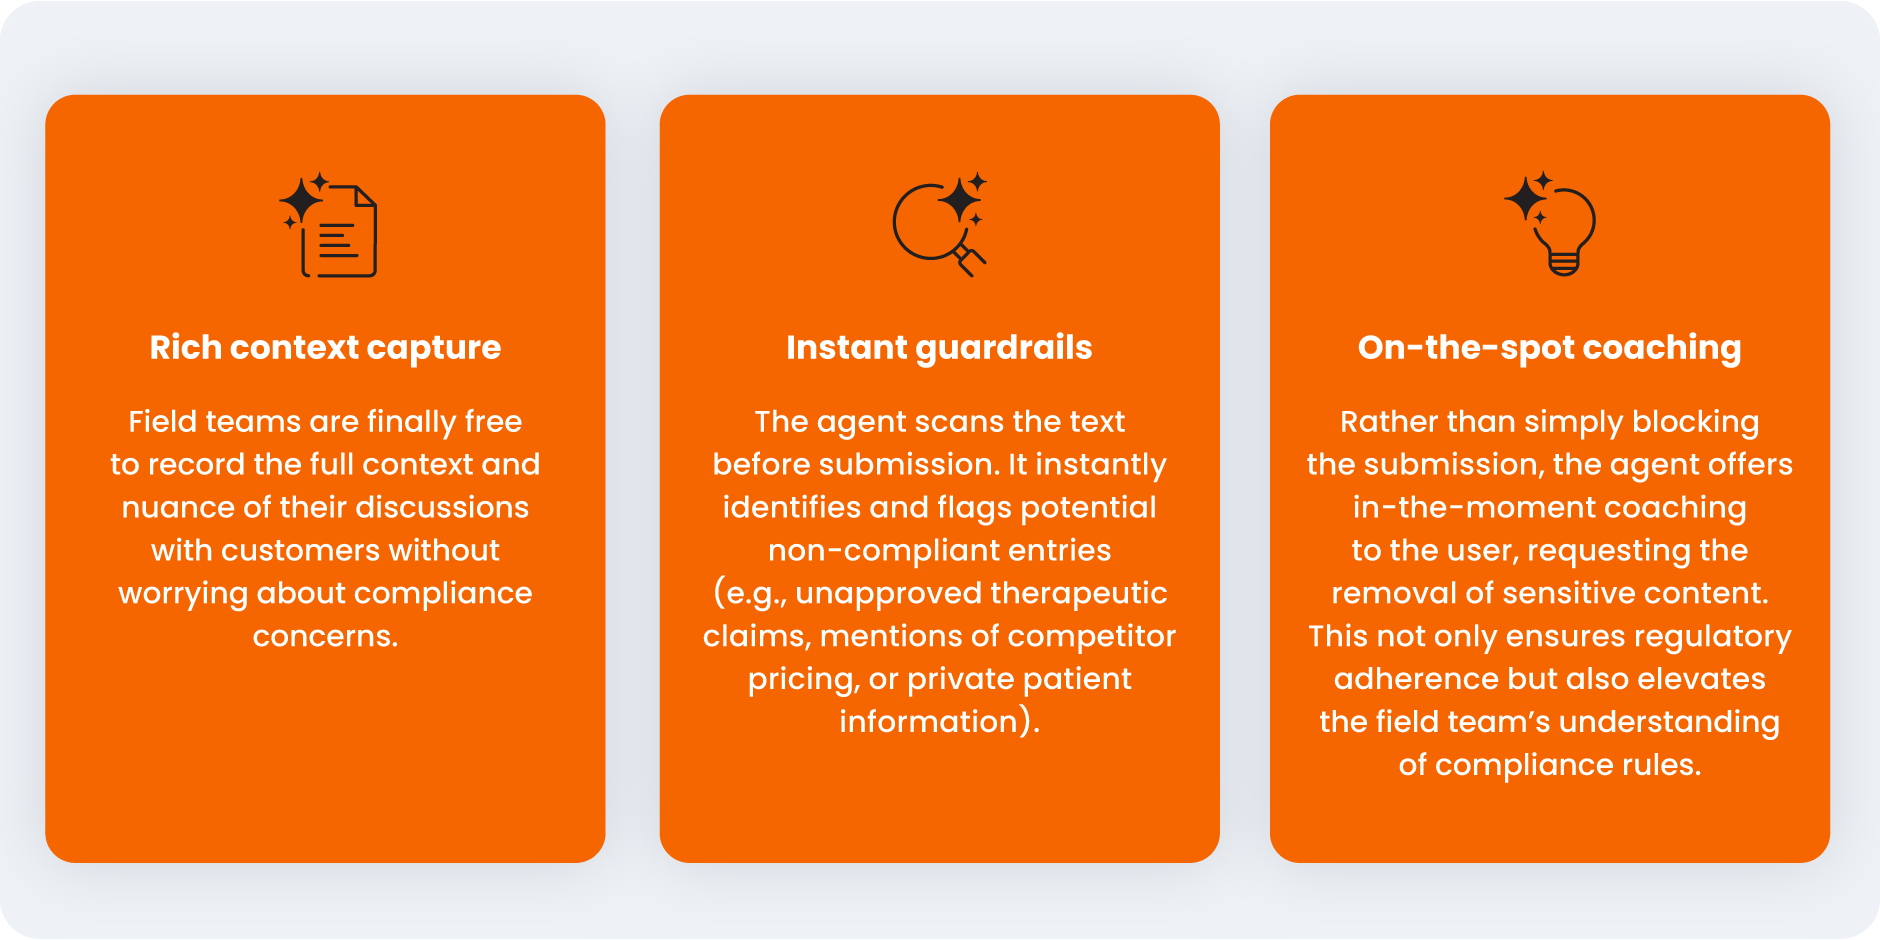
Free Text Agent offers a real-time, proactive compliance check and coaching tool that enables:
“If the move toward structured information capture was to enable greater consistency and compliance, now we can possibly have the best of both worlds. We can permit field members to express themselves in their own vernacular, with the tools getting to a place where we benefit from unstructured compliant feedback,” says Dale Cooke, a regulatory attorney for life sciences and medical device companies.
“If the move toward structured information capture was to enable greater consistency and compliance, now we can possibly have the best of both worlds. We can permit field members to express themselves in their own vernacular, with the tools getting to a place where we benefit from unstructured compliant feedback.” Dale Cooke Regulatory attorney for life sciences and medical device companies
The new technology in Free Text Agent is foundational for getting the most value from more advanced commercial tools. For instance, pre-call agents and orchestration engines require deep engagement detail to operate effectively.
Test, learn, and scale
Connecting free text capture to its business impact is essential. Commercial and compliance leaders must agree on free text’s role in driving commercial and medical innovation.
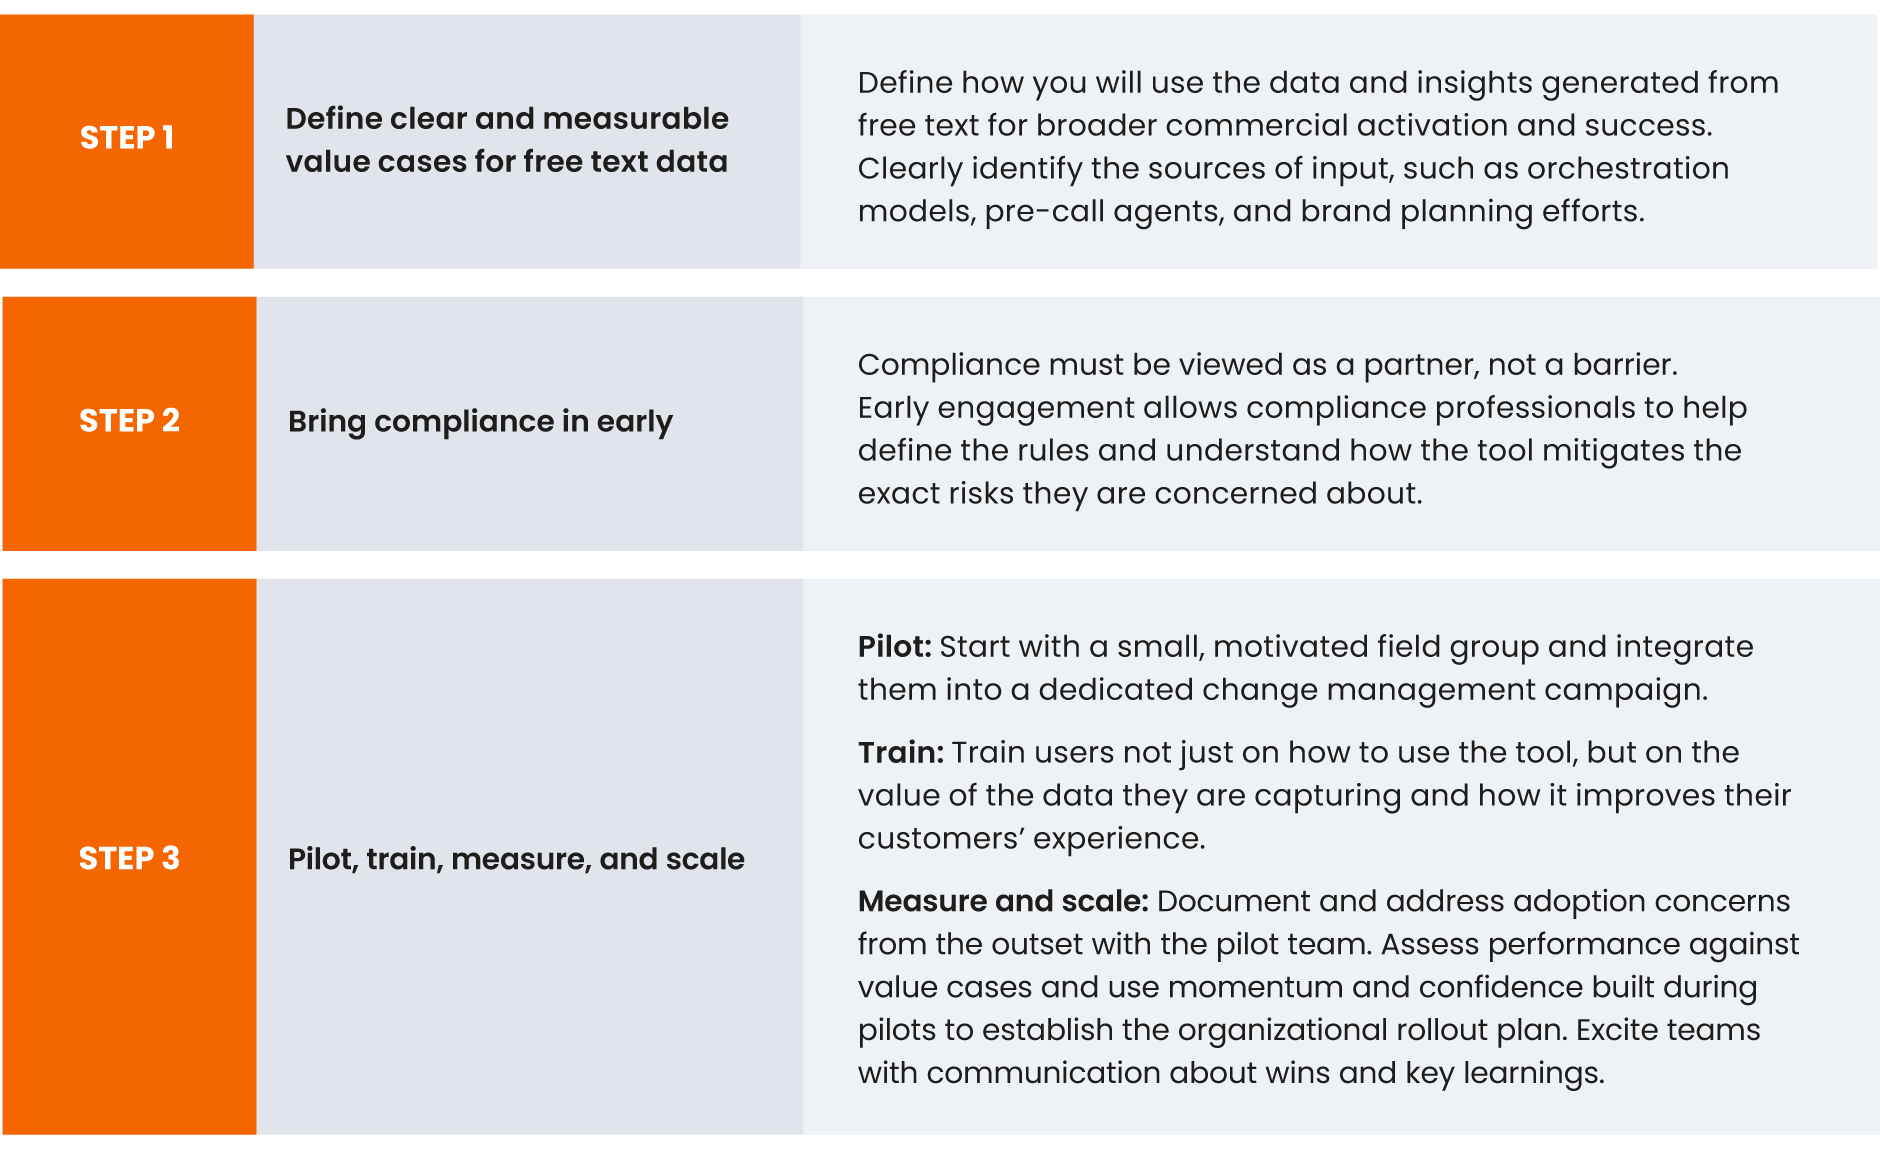
Early adopters of the AI agent for compliant free text are taking a structured, phased project approach:
Shifting to the use of free text is a necessity for advancing relationship management and omnichannel orchestration. The organizations that compliantly tap into and apply their own rich, primary engagement data will execute the most efficient and effective engagement model for the future.
Ensure your commercial and medical teams are prepared to leverage the
full impact of AI agents with Veeva Business Consulting’s in-depth analysis.
Global and Regional Trends
This report highlights global and regional field engagement trends from Veeva HCP 360 data gathered between October 2024 and September 2025. Veeva HCP 360 data is sourced from Veeva’s aggregated CRM activity, including field engagement stats from all instances of Veeva CRM globally. In this report, comparisons in trending charts are year over year, Q3 2024 to Q3 2025, while non-trending charts contain quarter-over-quarter comparisons, Q2 2025 to Q3 2025.
Global trends*
Figure 1: Channel mix evolution, global
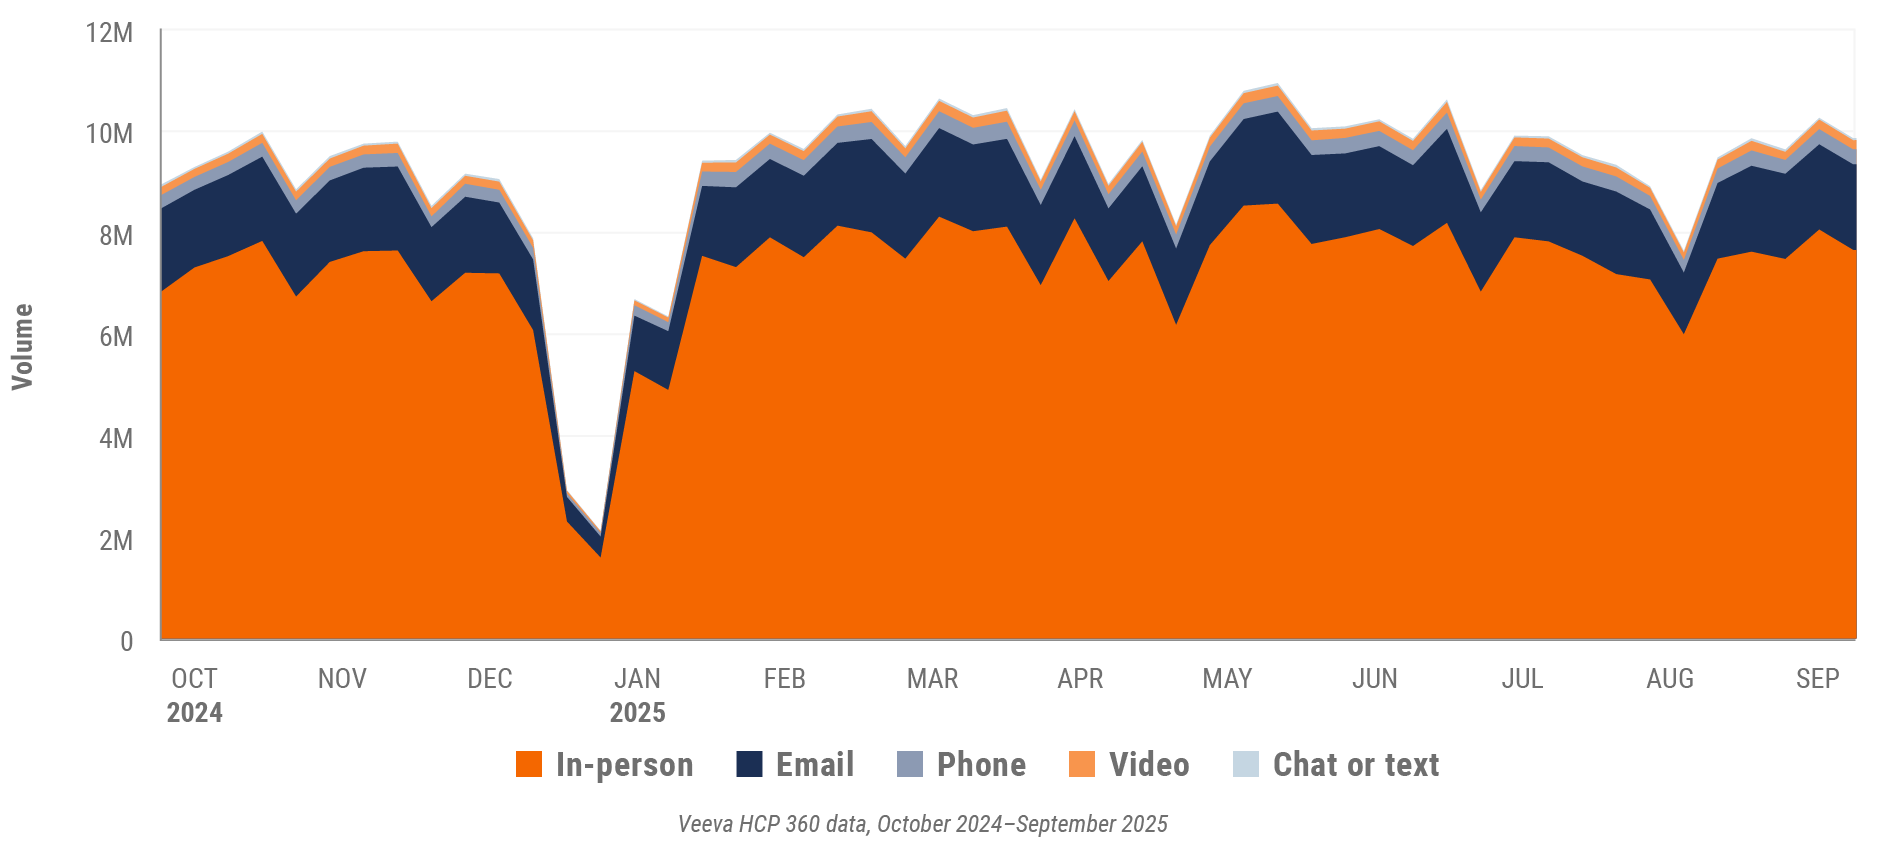
Figure 2: Channel mix, global

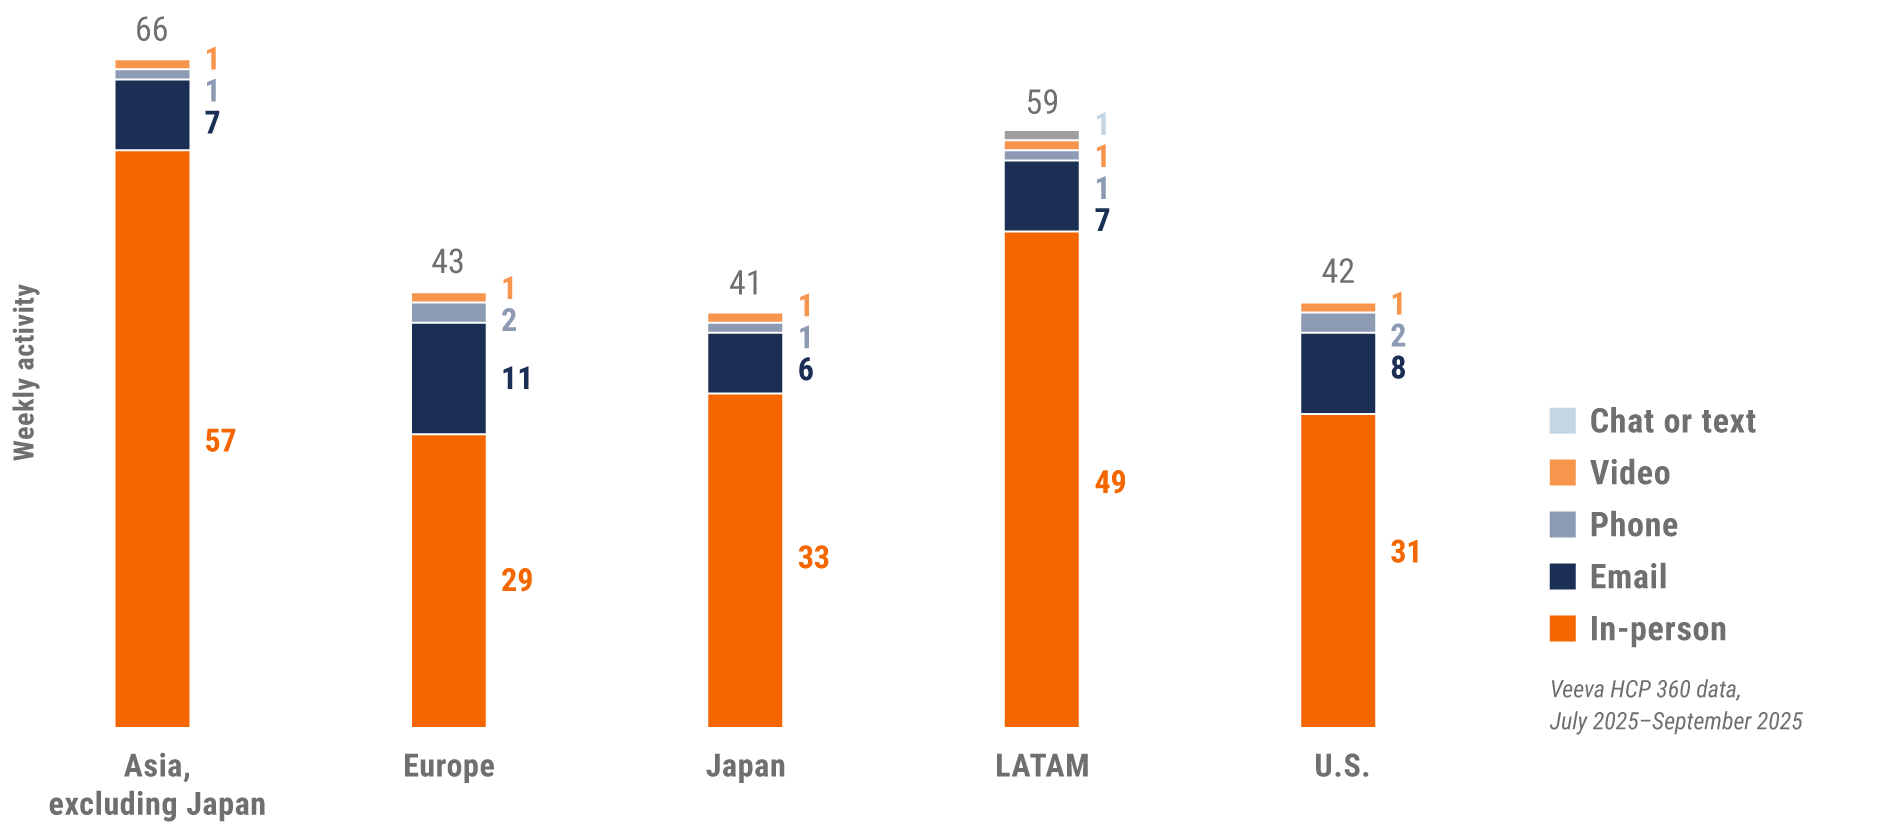
Global field team activity Weekly activity per user by engagement channel
Figure 3: Activity by region, global
Global engagement quality Consolidation of key quality metrics
Figure 4: Approved email volume, global
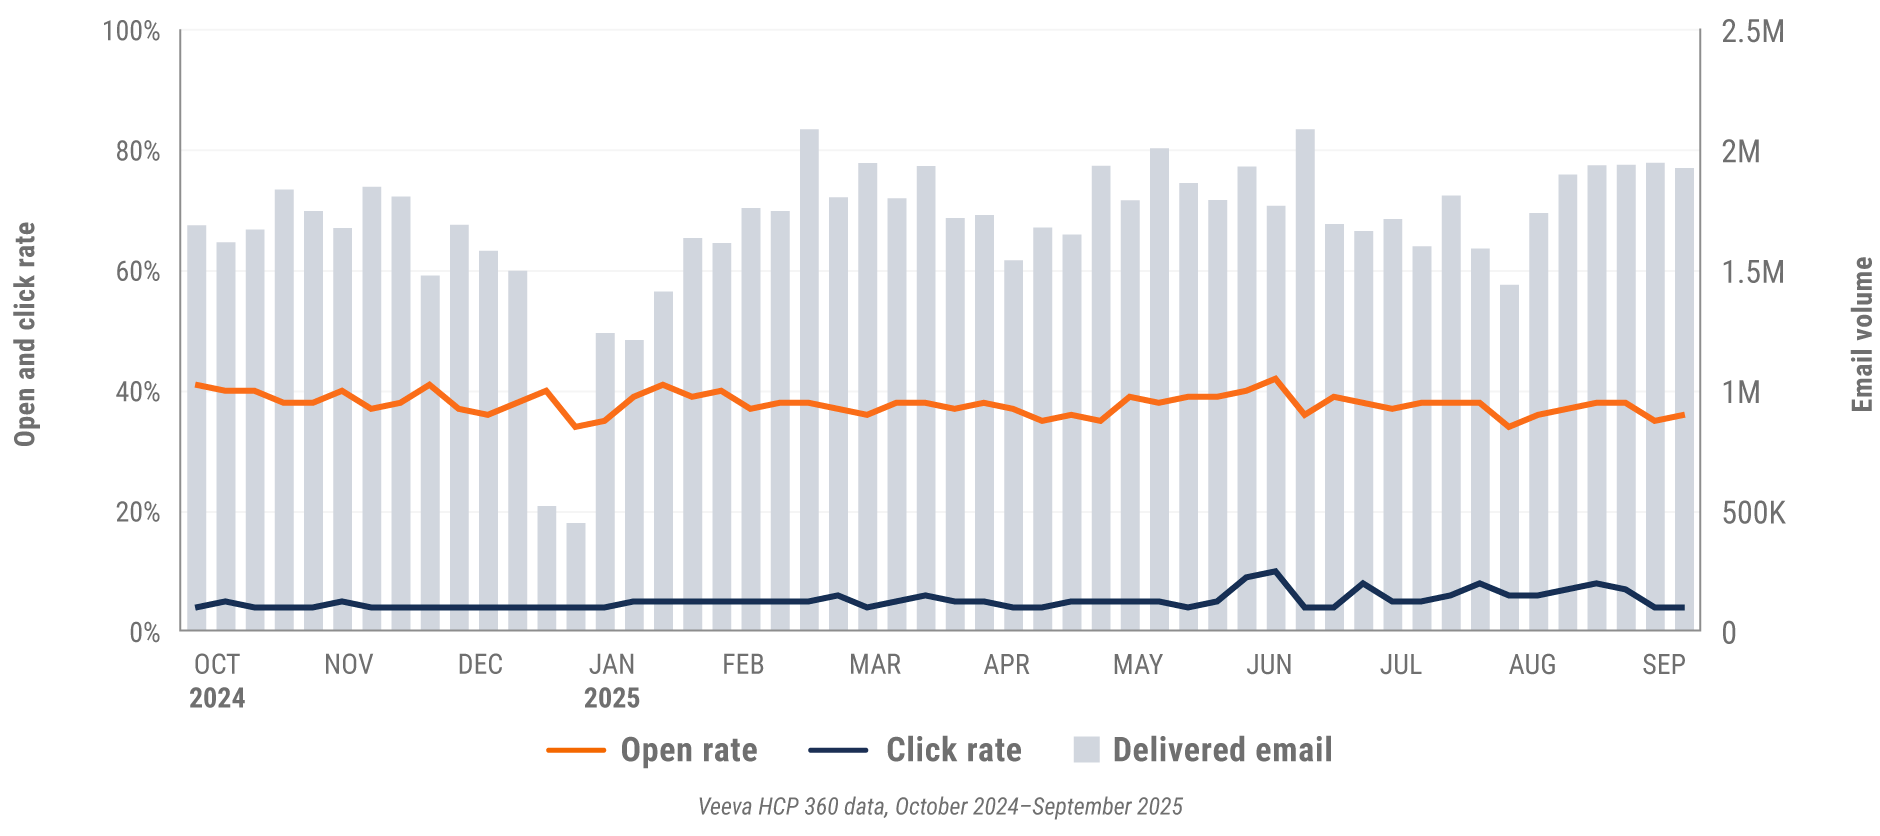
Figure 5: Content usage by channel, global
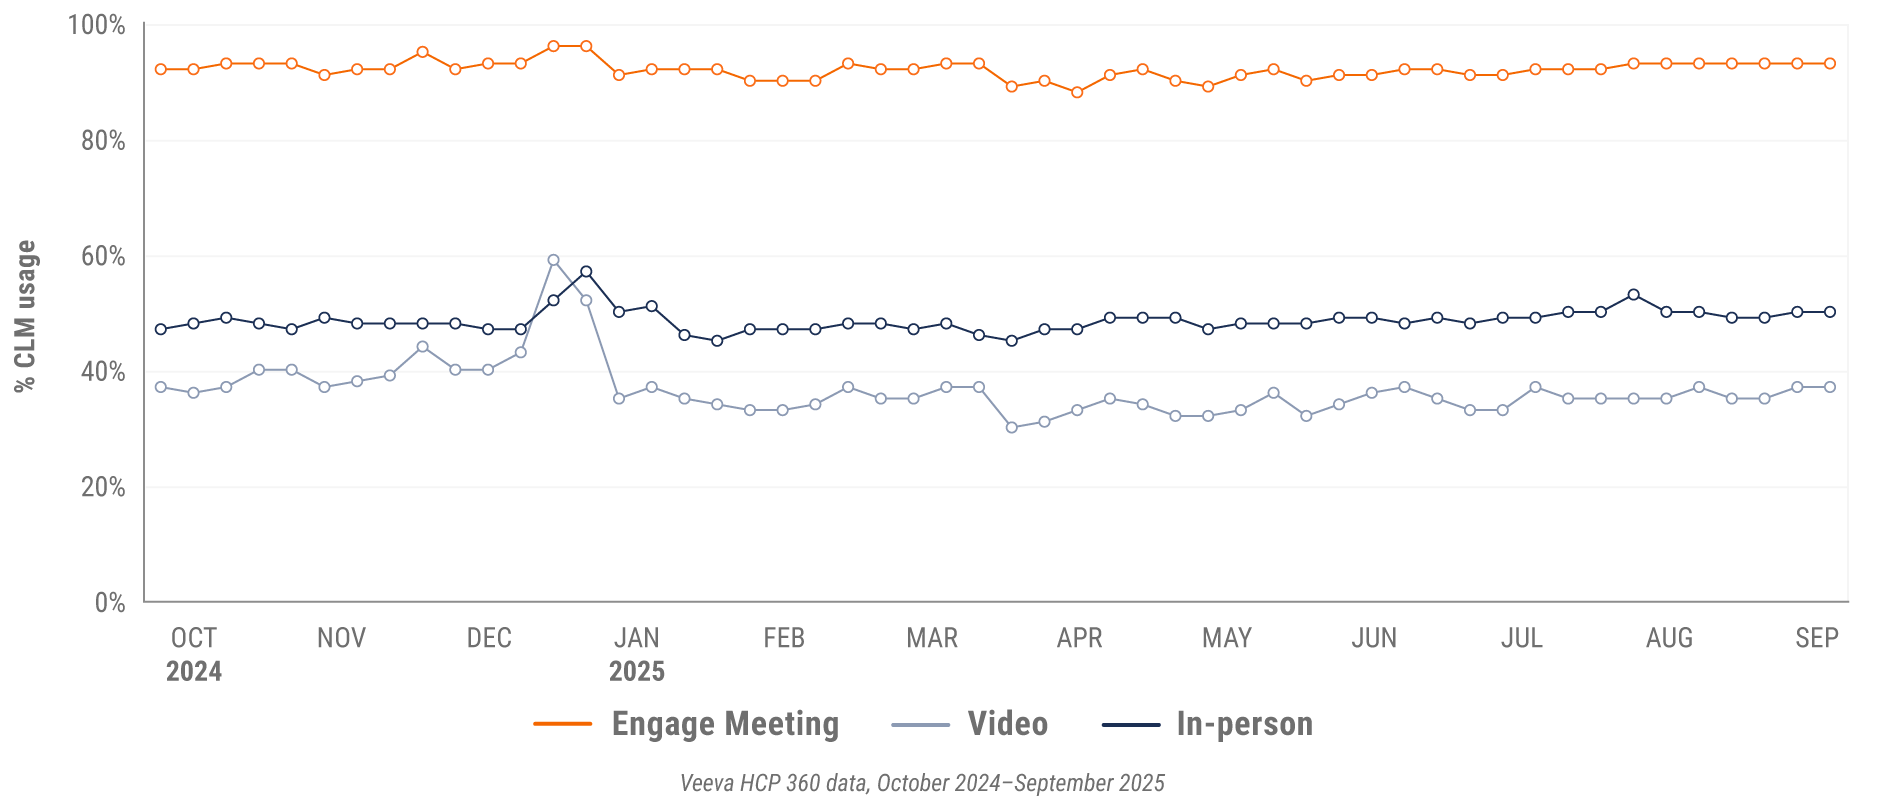
Figure 6: Veeva CRM Engage meeting duration, global

*This quarter’s global trends report omits data from China.
U.S. market trends
Figure 7: Channel mix evolution, U.S.
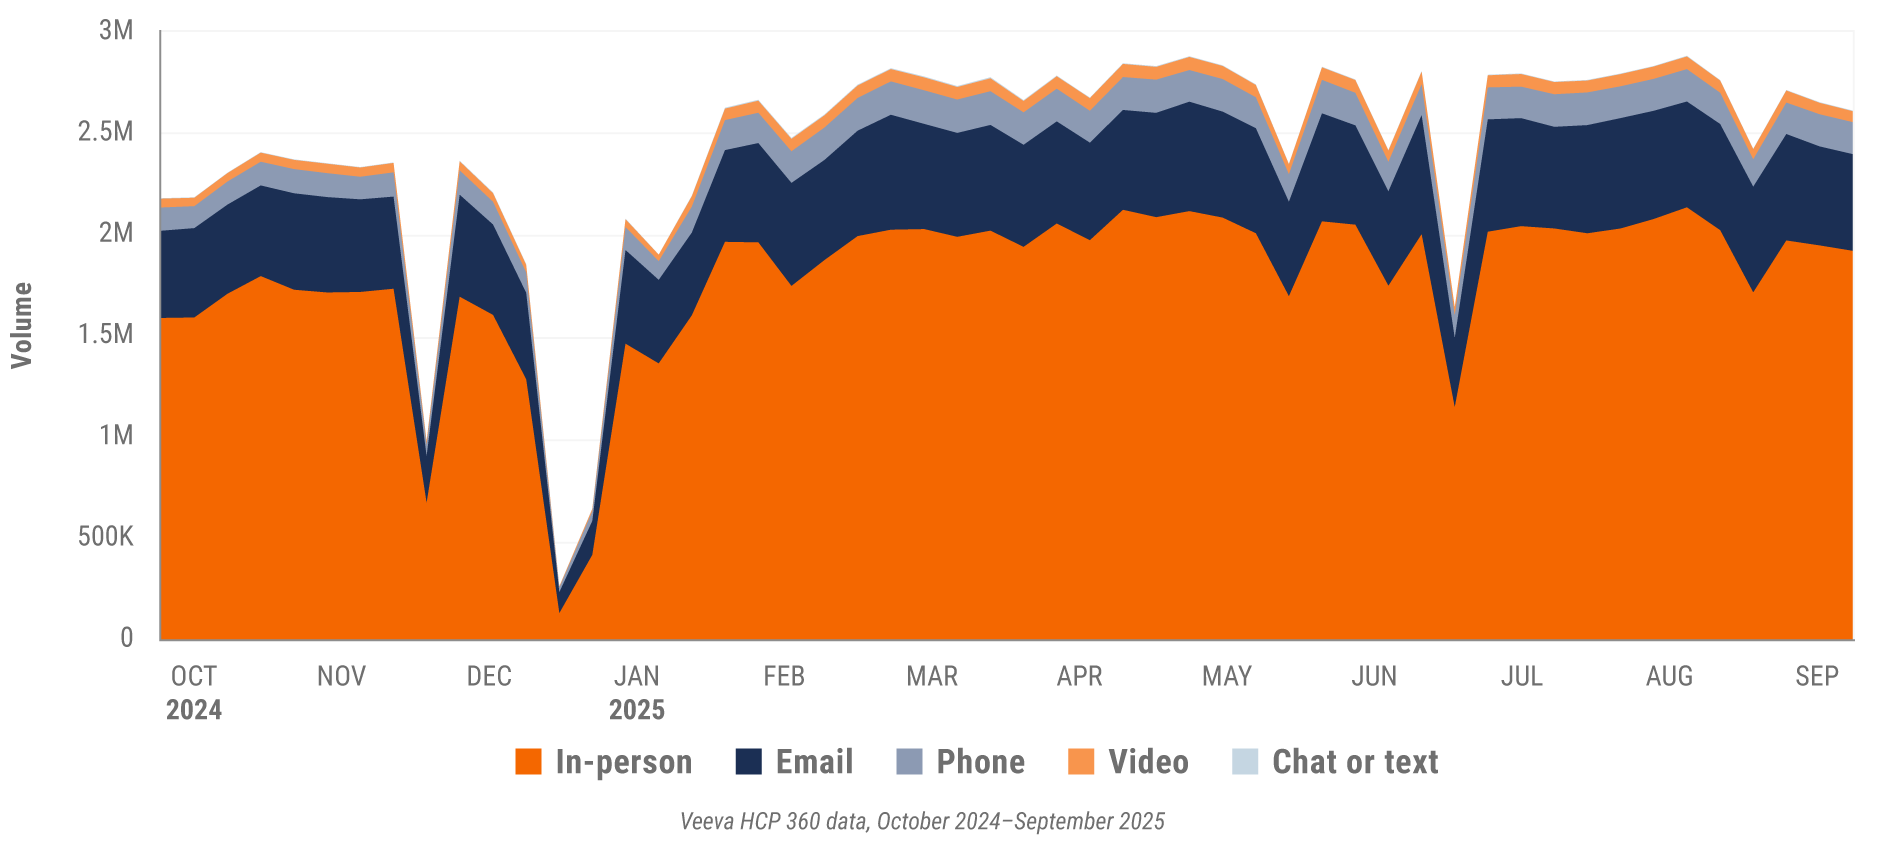
Figure 8: Channel mix, U.S.

U.S. field team activity Weekly activity per user by engagement channel
Figure 9: Activity, U.S.
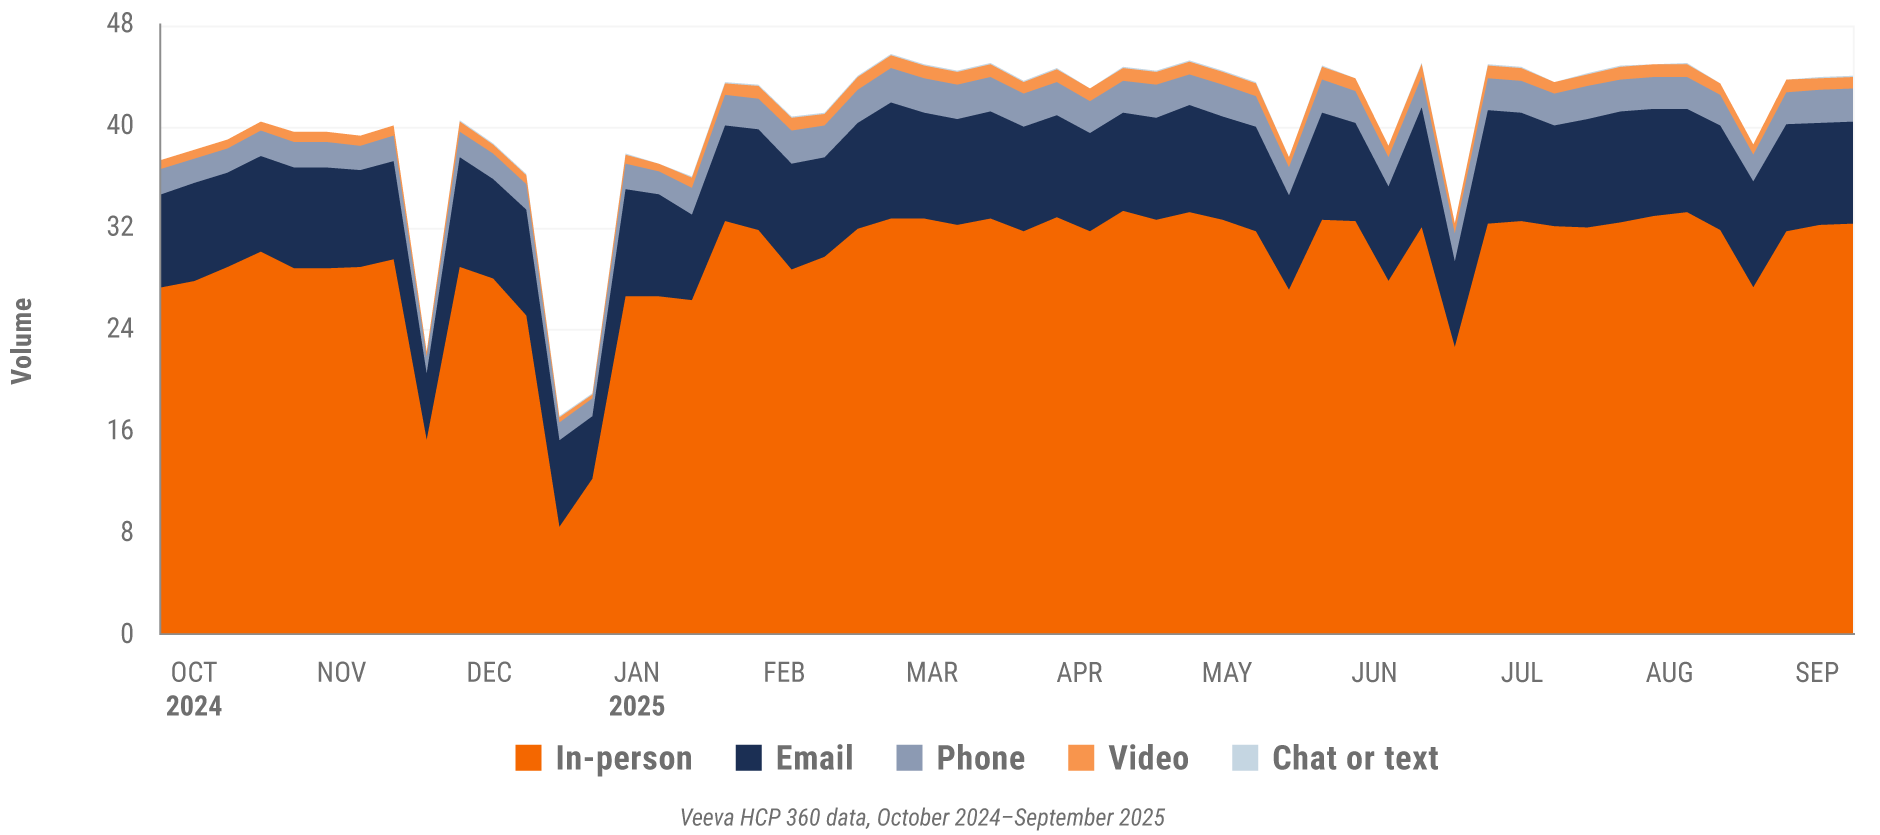
U.S. engagement quality Consolidation of key quality metrics
Figure 10: Approved email volume, U.S.
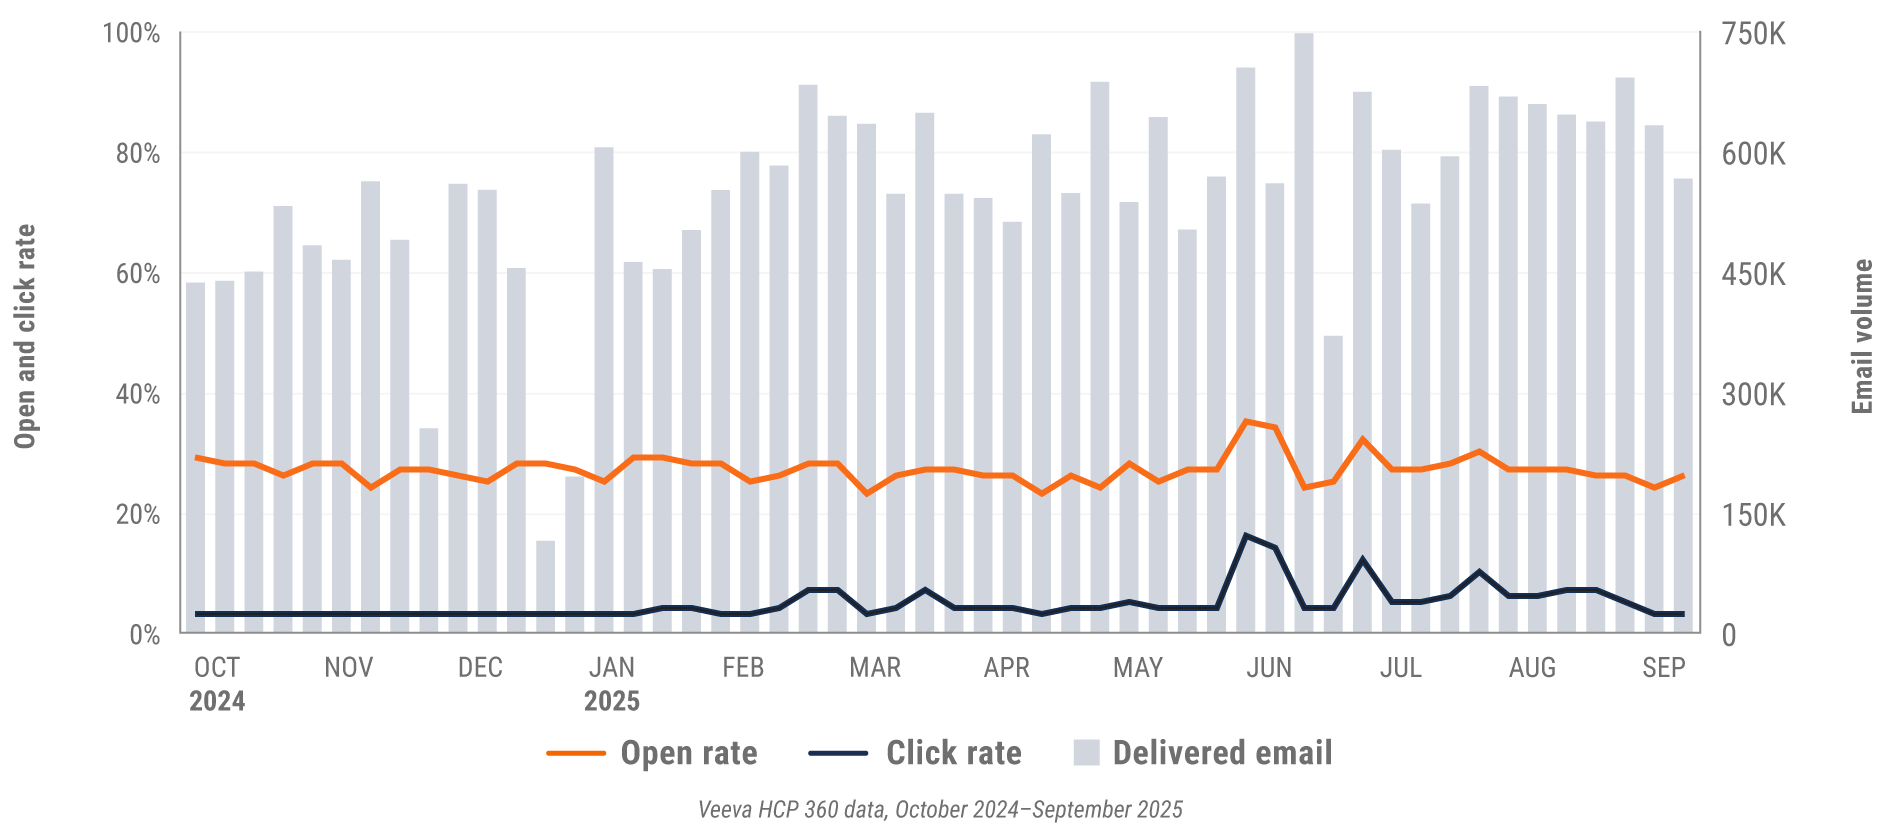
Figure 11: Content usage by channel, U.S.
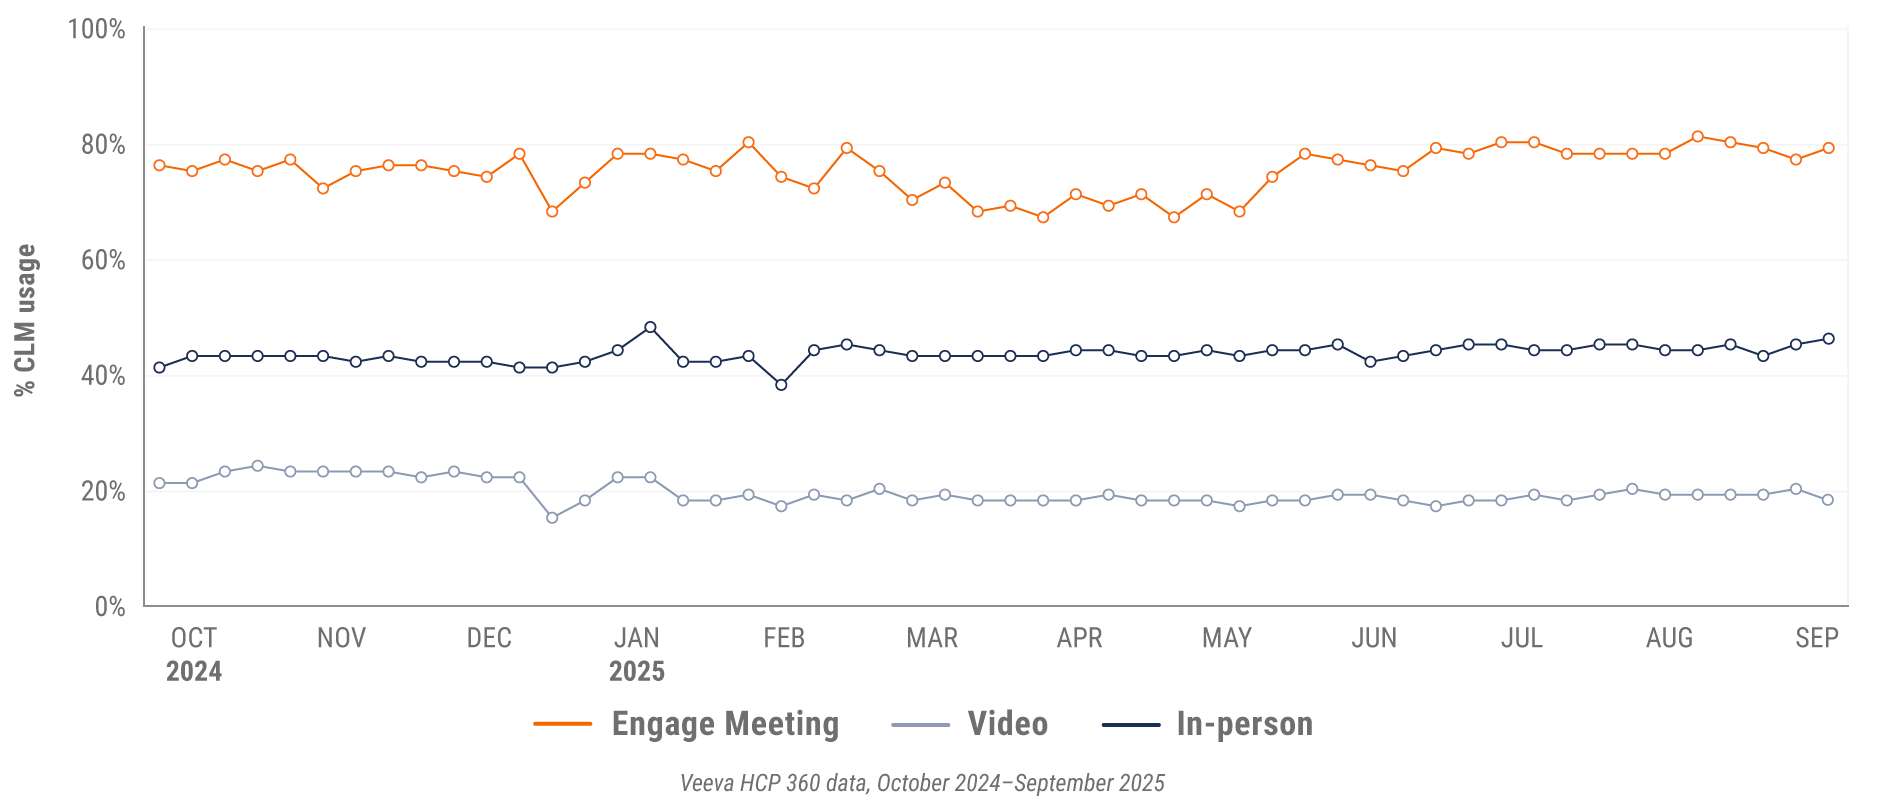
Figure 12: Veeva CRM Engage meeting duration, U.S.

Europe market trends
Figure 13: Channel mix evolution, Europe
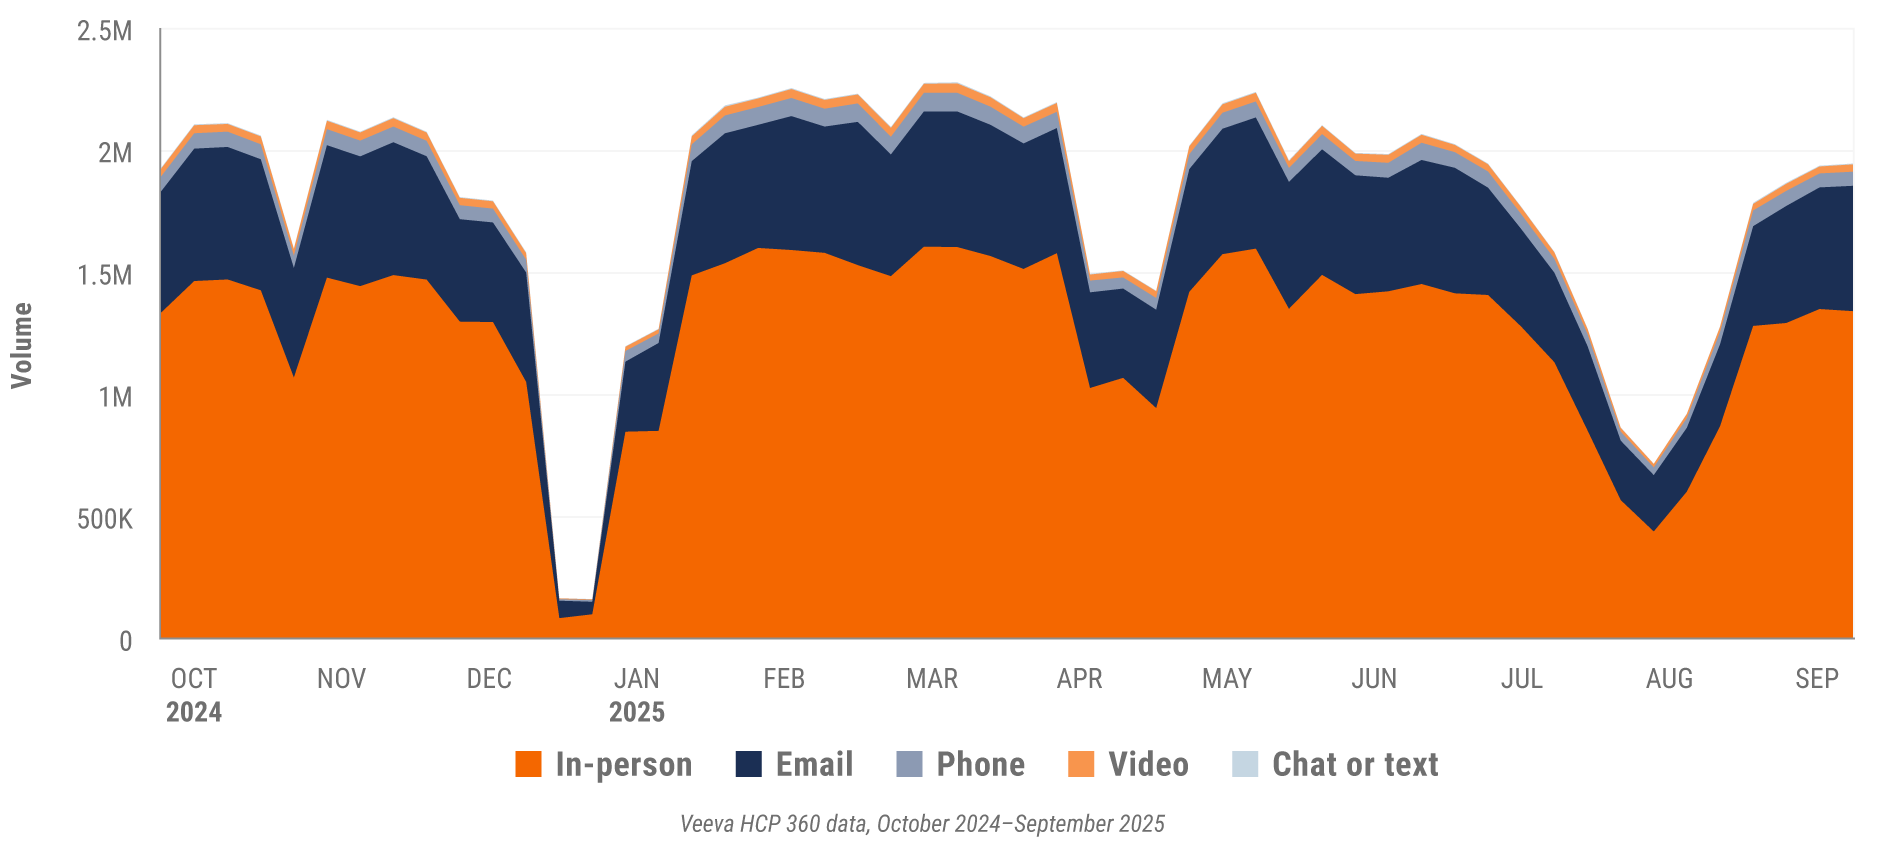
Figure 14: Channel mix, Europe

Europe field team activity Weekly activity per user by engagement channel
Figure 15: Activity by country, EU5
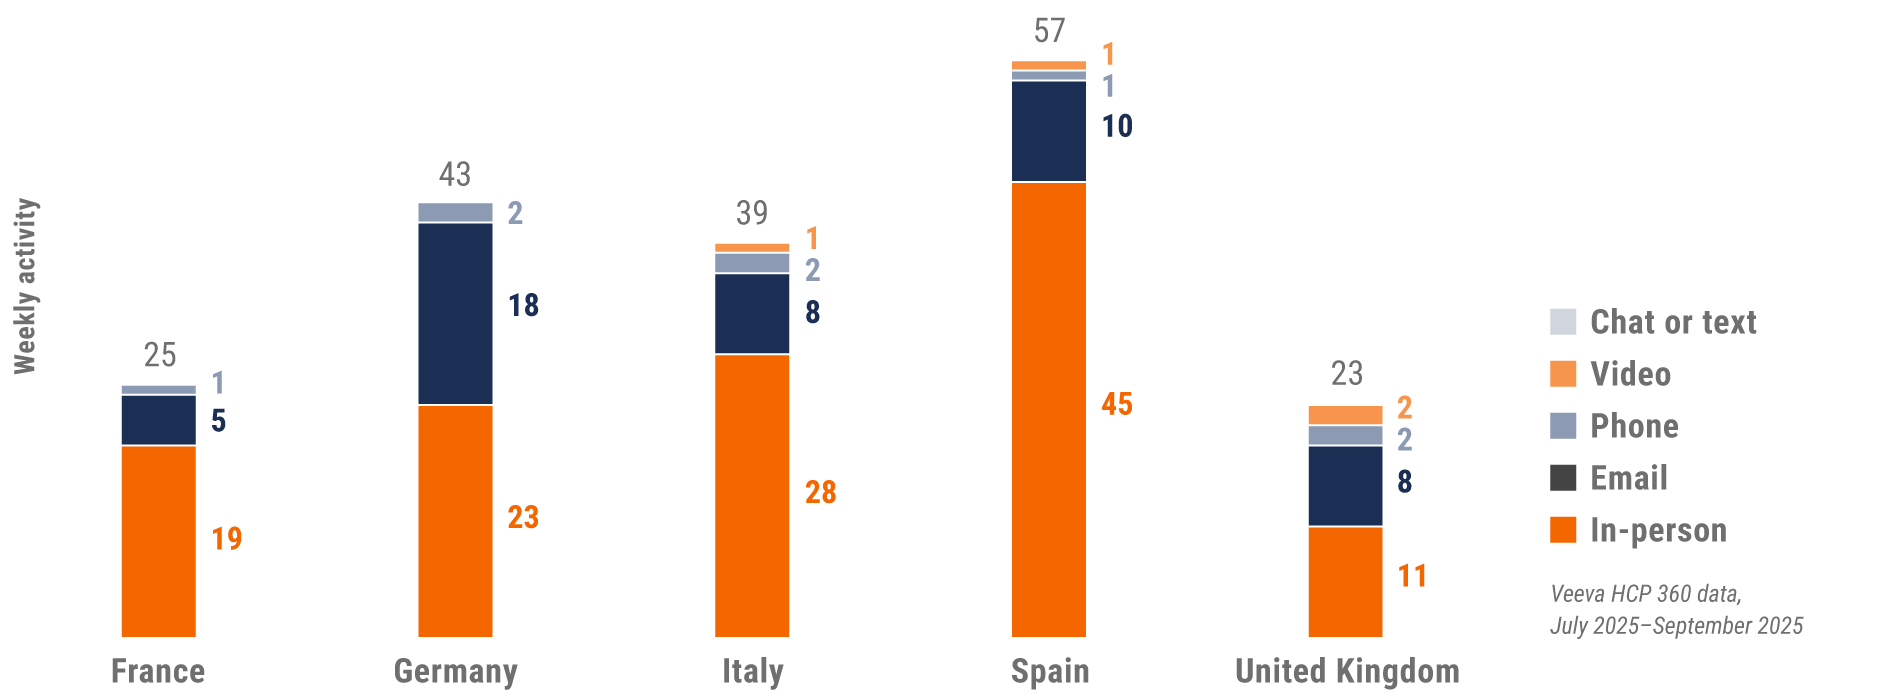
Europe engagement quality Consolidation of key quality metrics
Figure 16: Approved email volume, Europe
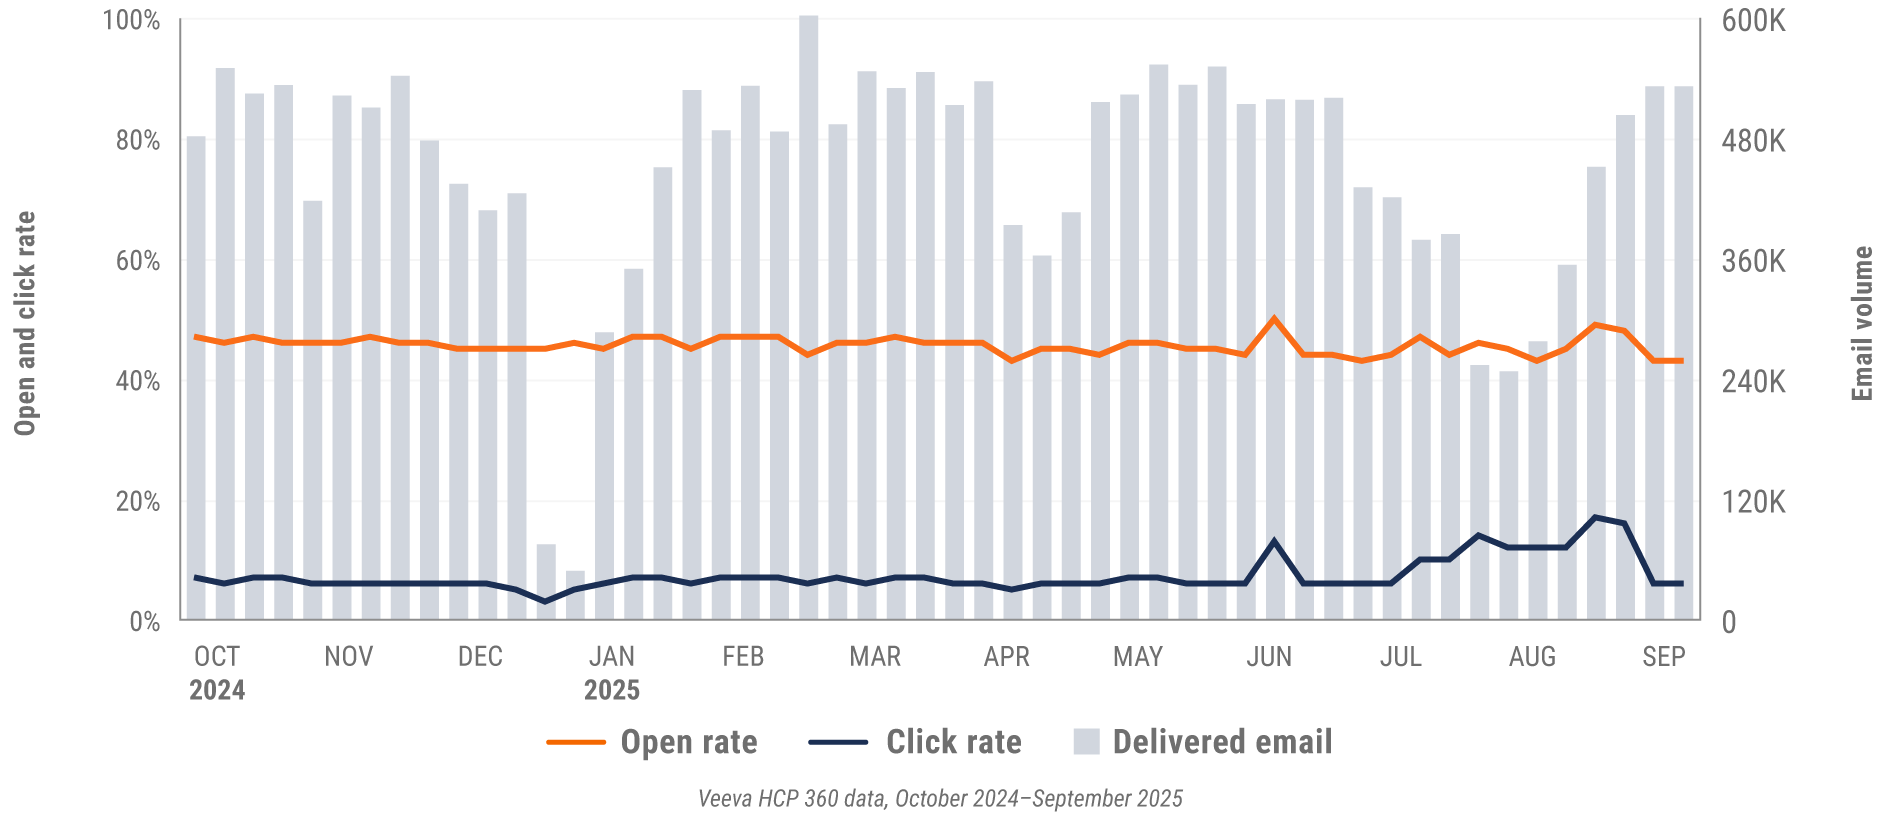
Figure 17: Content usage by channel, Europe
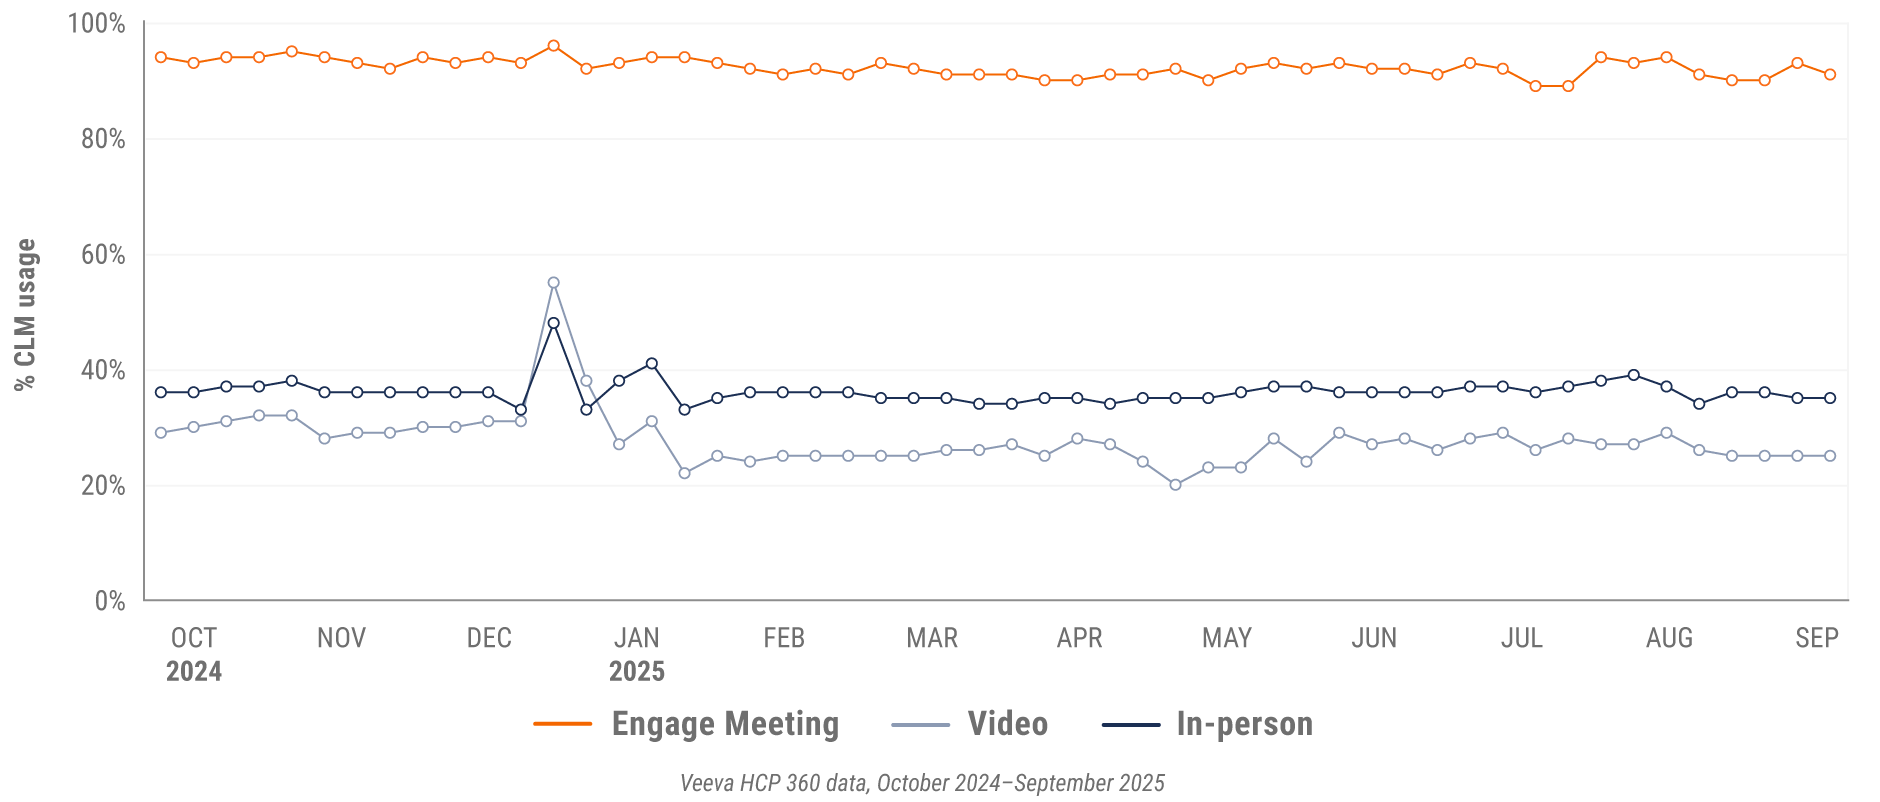
Figure 18: Veeva CRM Engage meeting duration, Europe

Asia market trends
Figure 19: Channel mix evolution, Asia
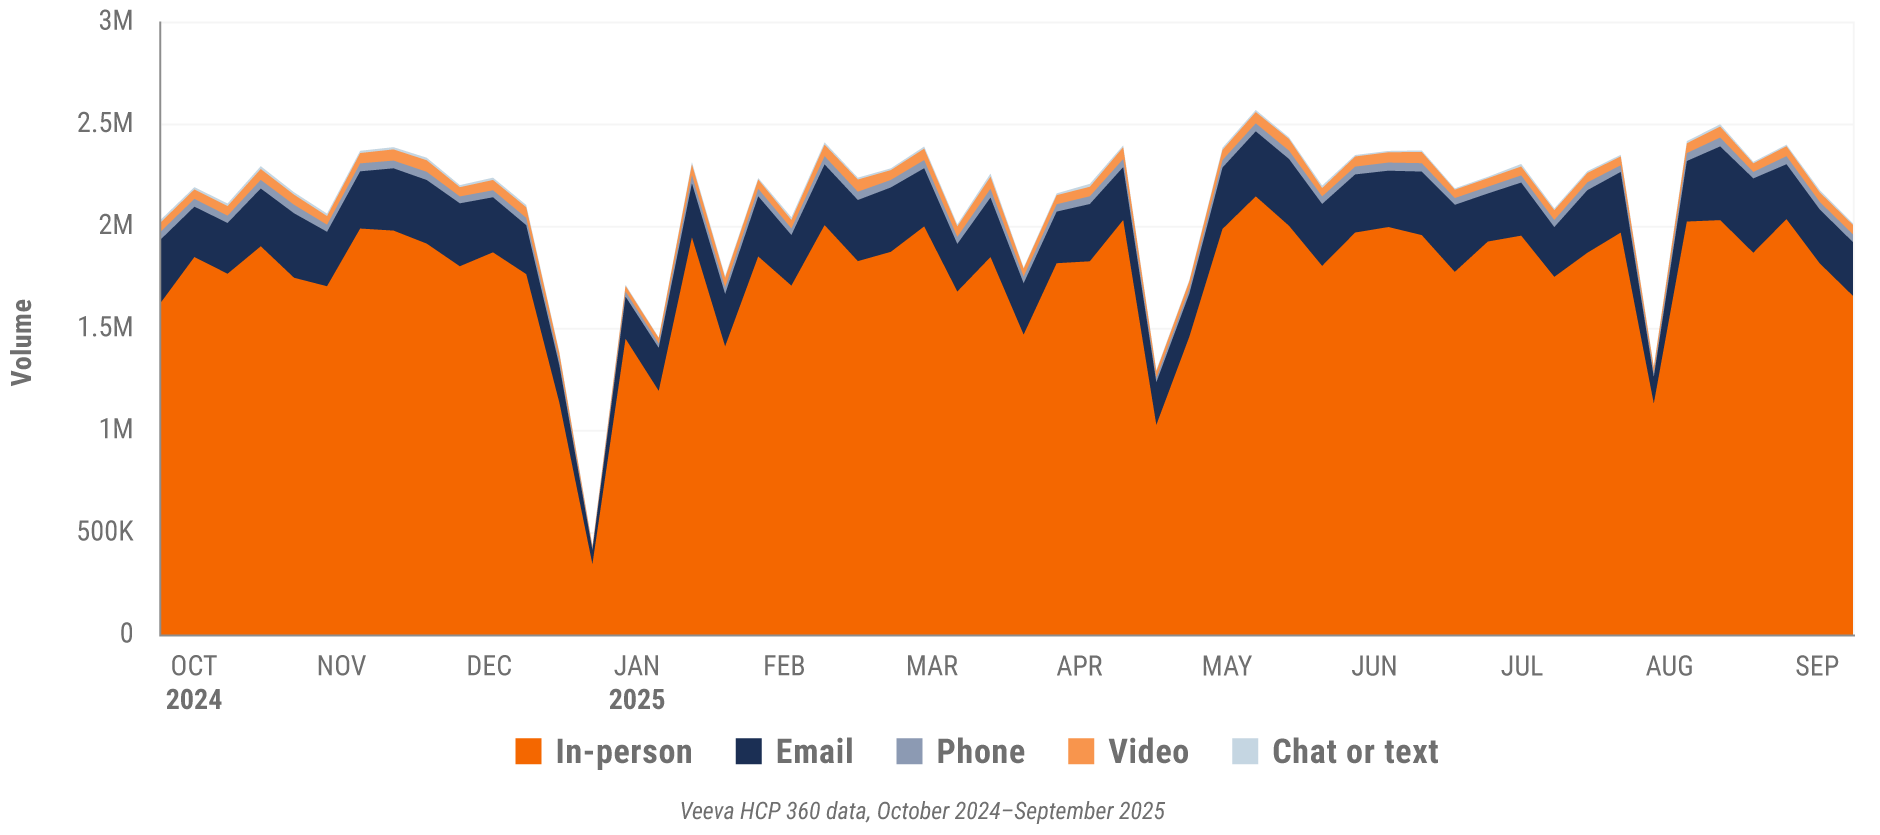
Figure 20: Channel mix, Asia

Asia field team activity Weekly activity per user by engagement channel
Figure 21: Activity by country, Asia
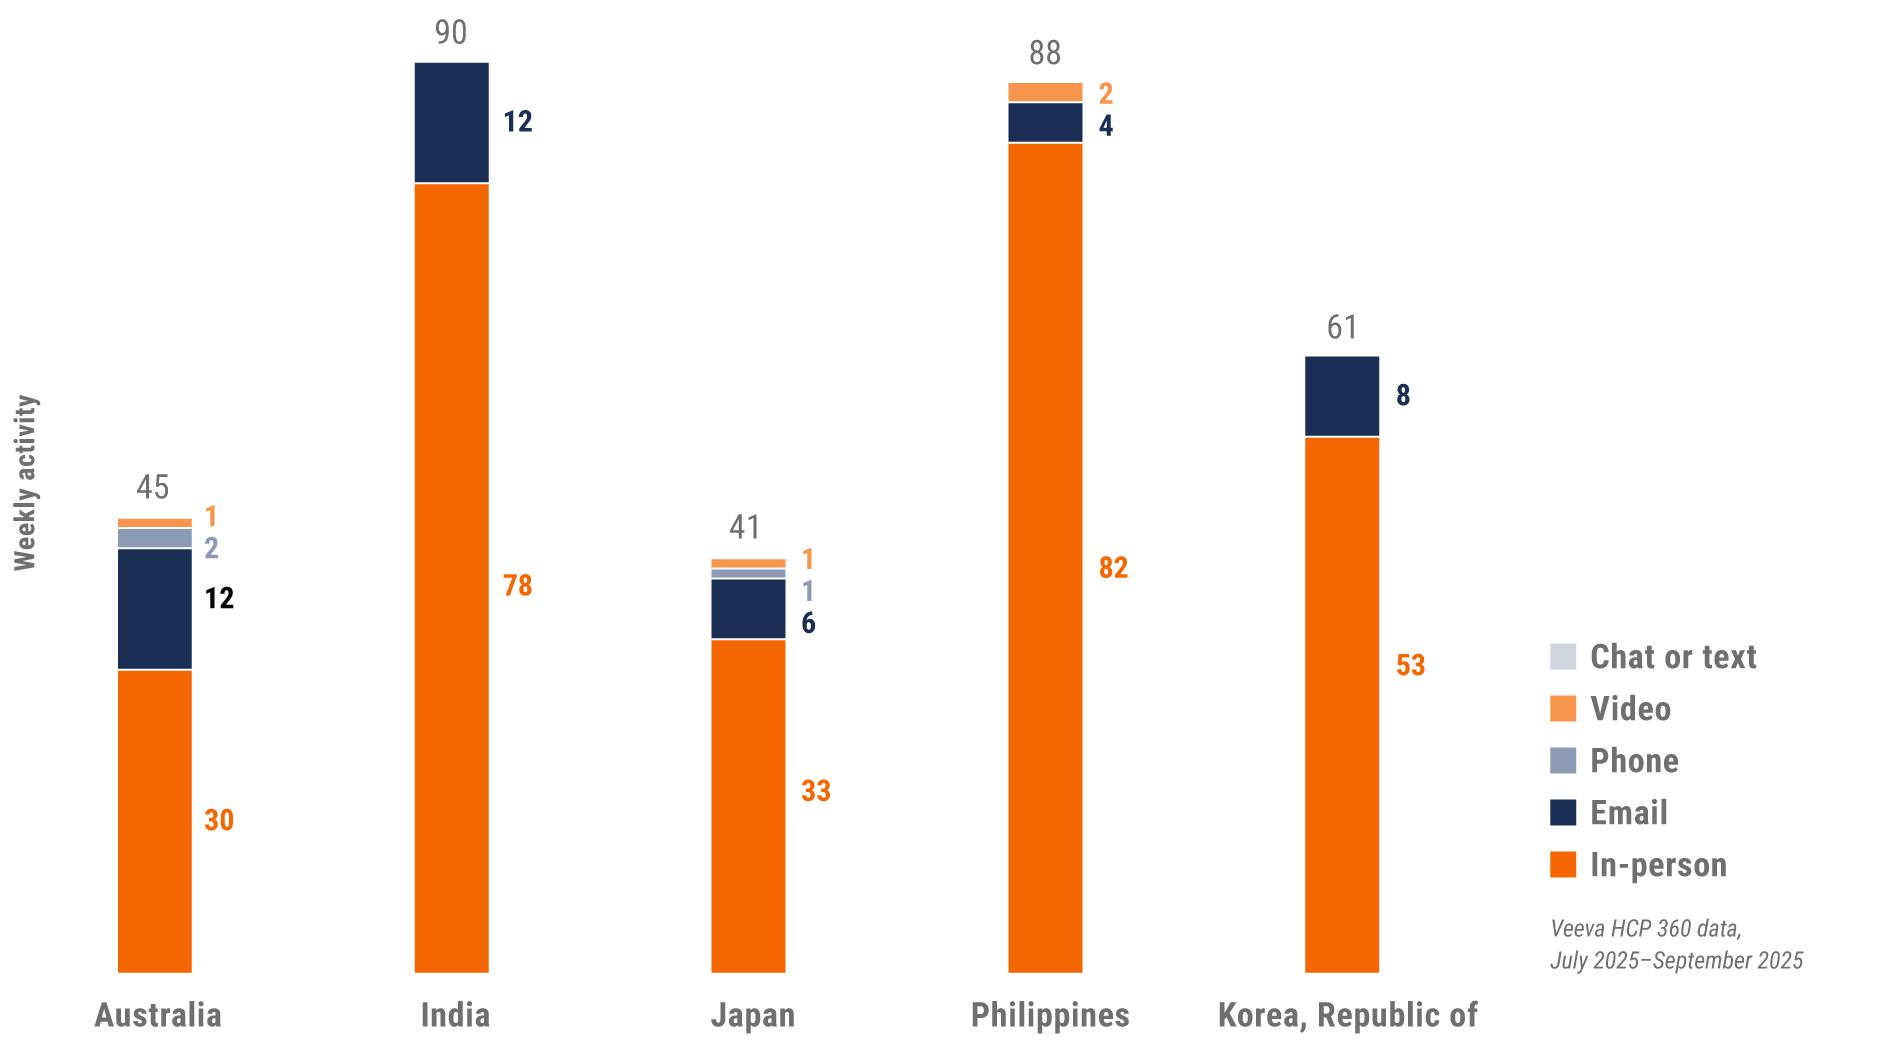
Asia engagement quality Consolidation of key quality metrics
Figure 22: Approved email volume, Asia
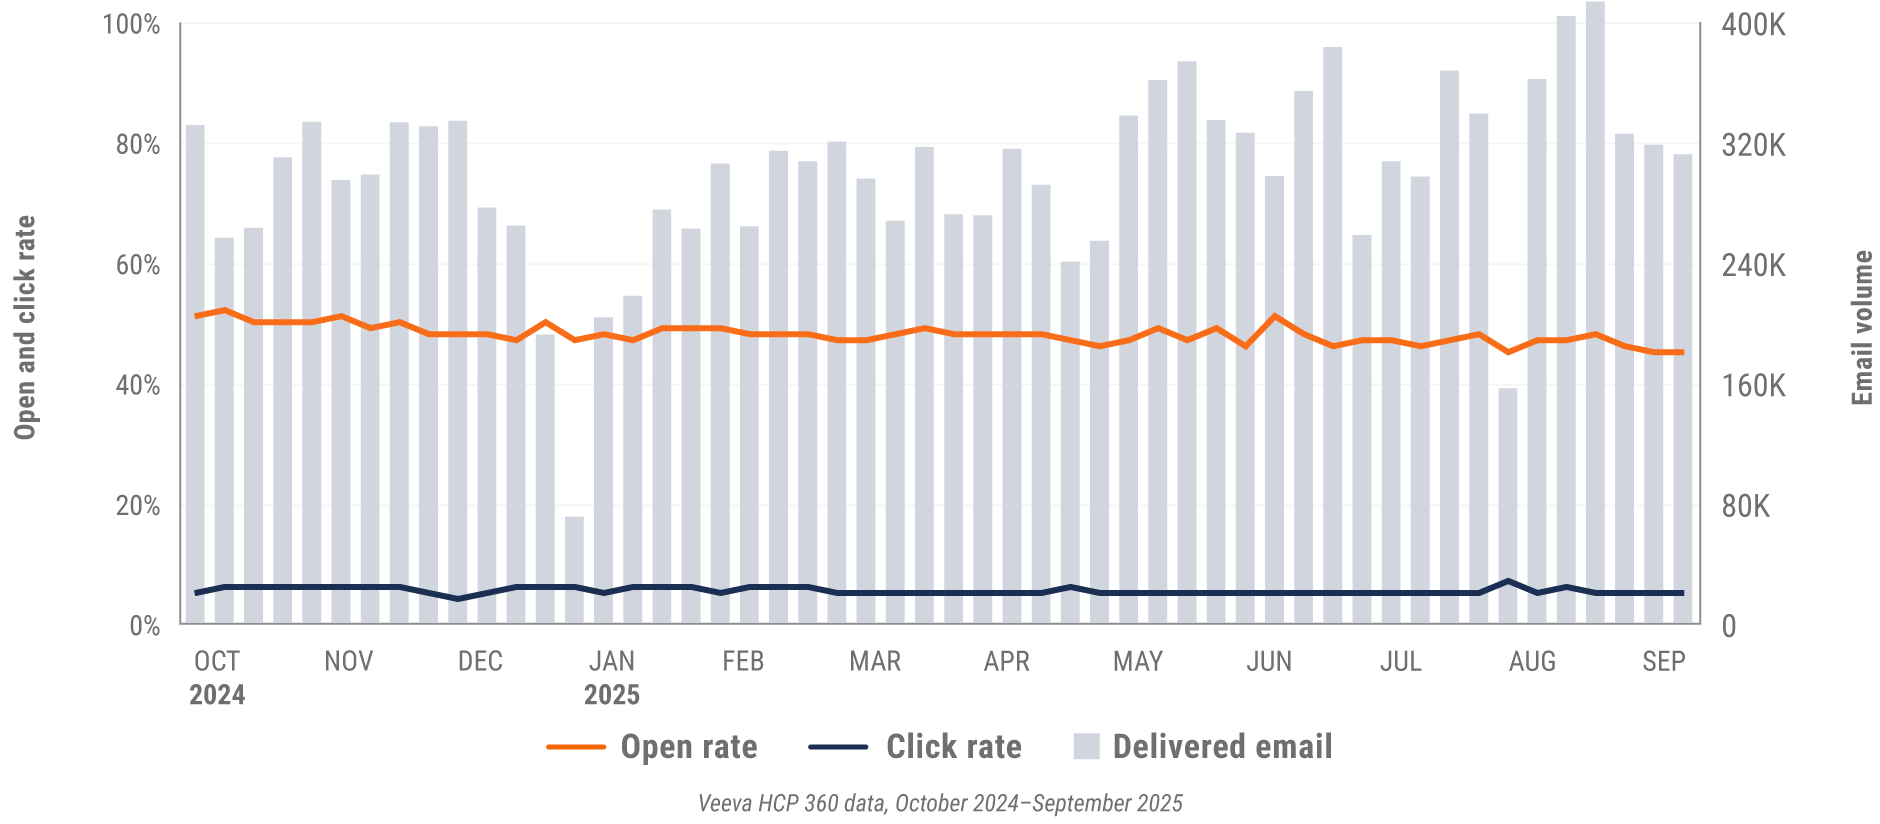
Figure 23: Content usage by channel, Asia
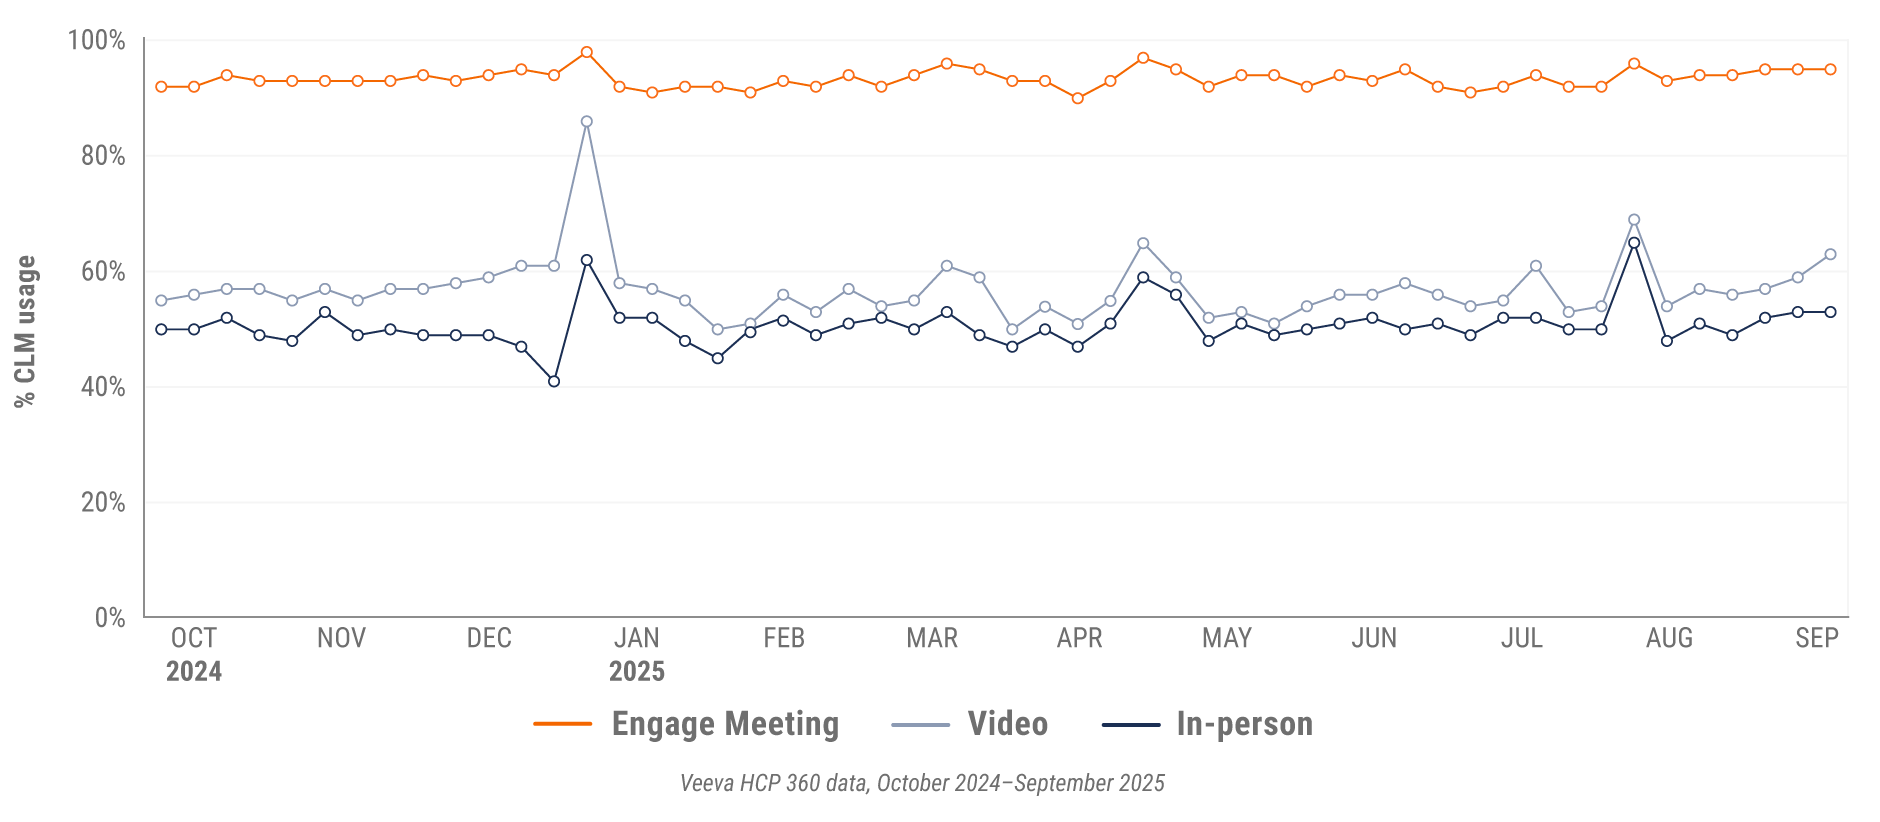
Figure 24: Veeva CRM Engage meeting duration, Asia

Latin America market trends
Figure 25: Channel mix evolution, Latin America
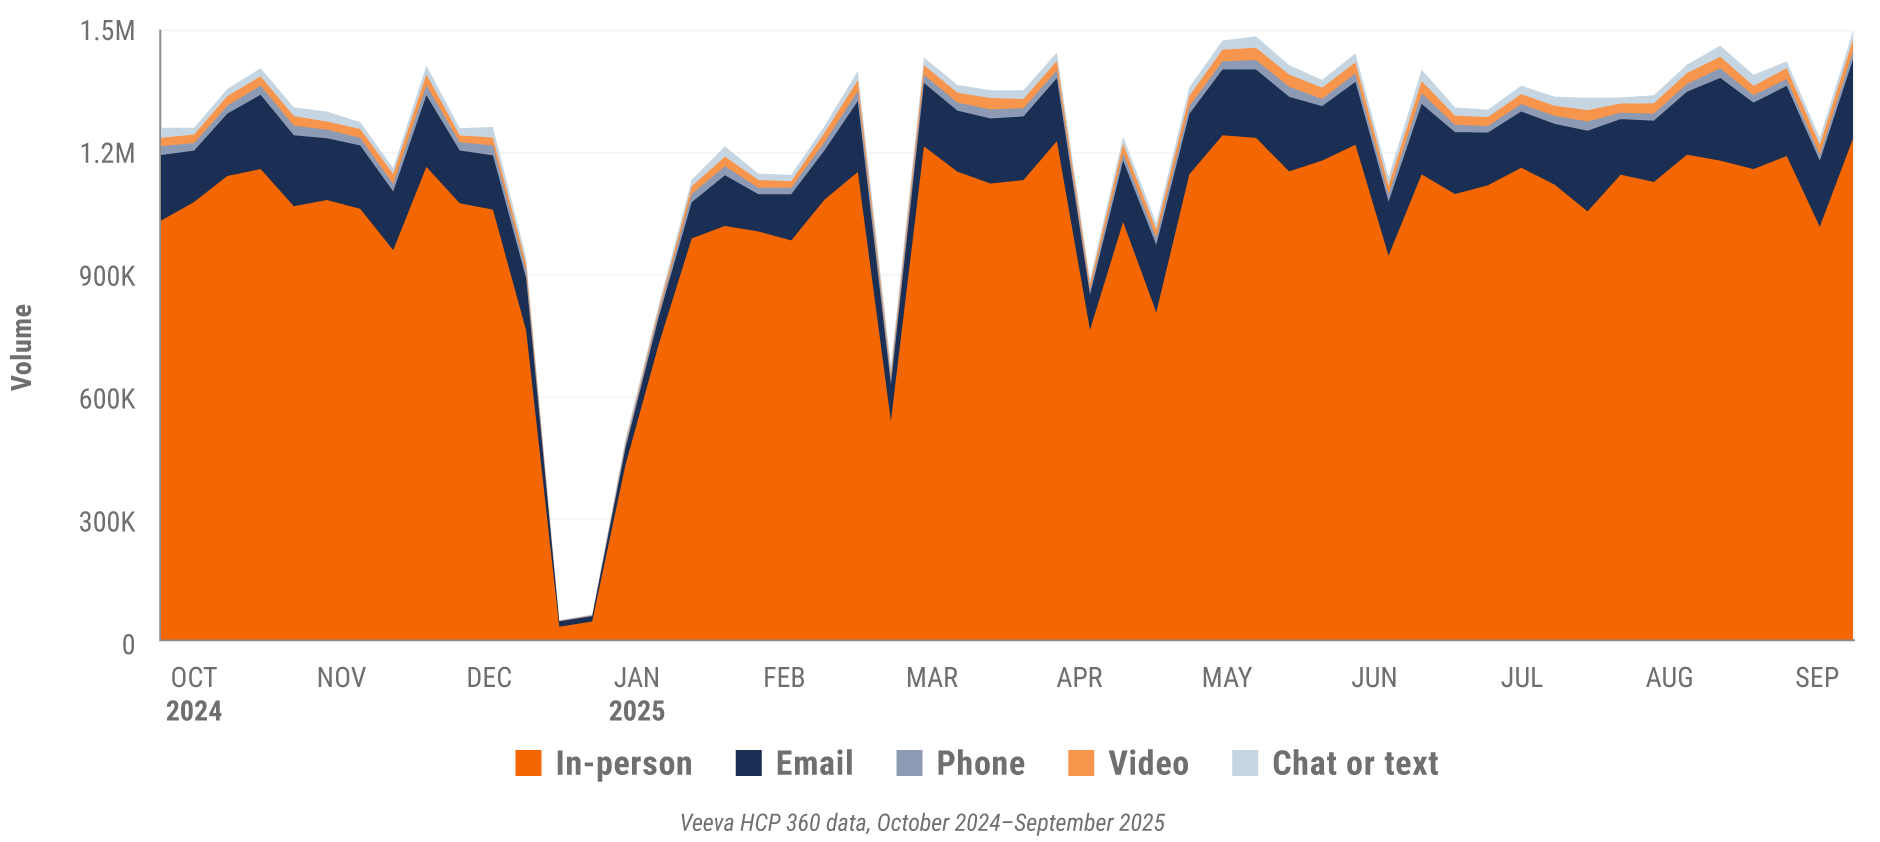
Figure 26: Channel mix, Latin America

Latin America field team activity Weekly activity per user by engagement channel
Figure 27: Activity by country, Latin America
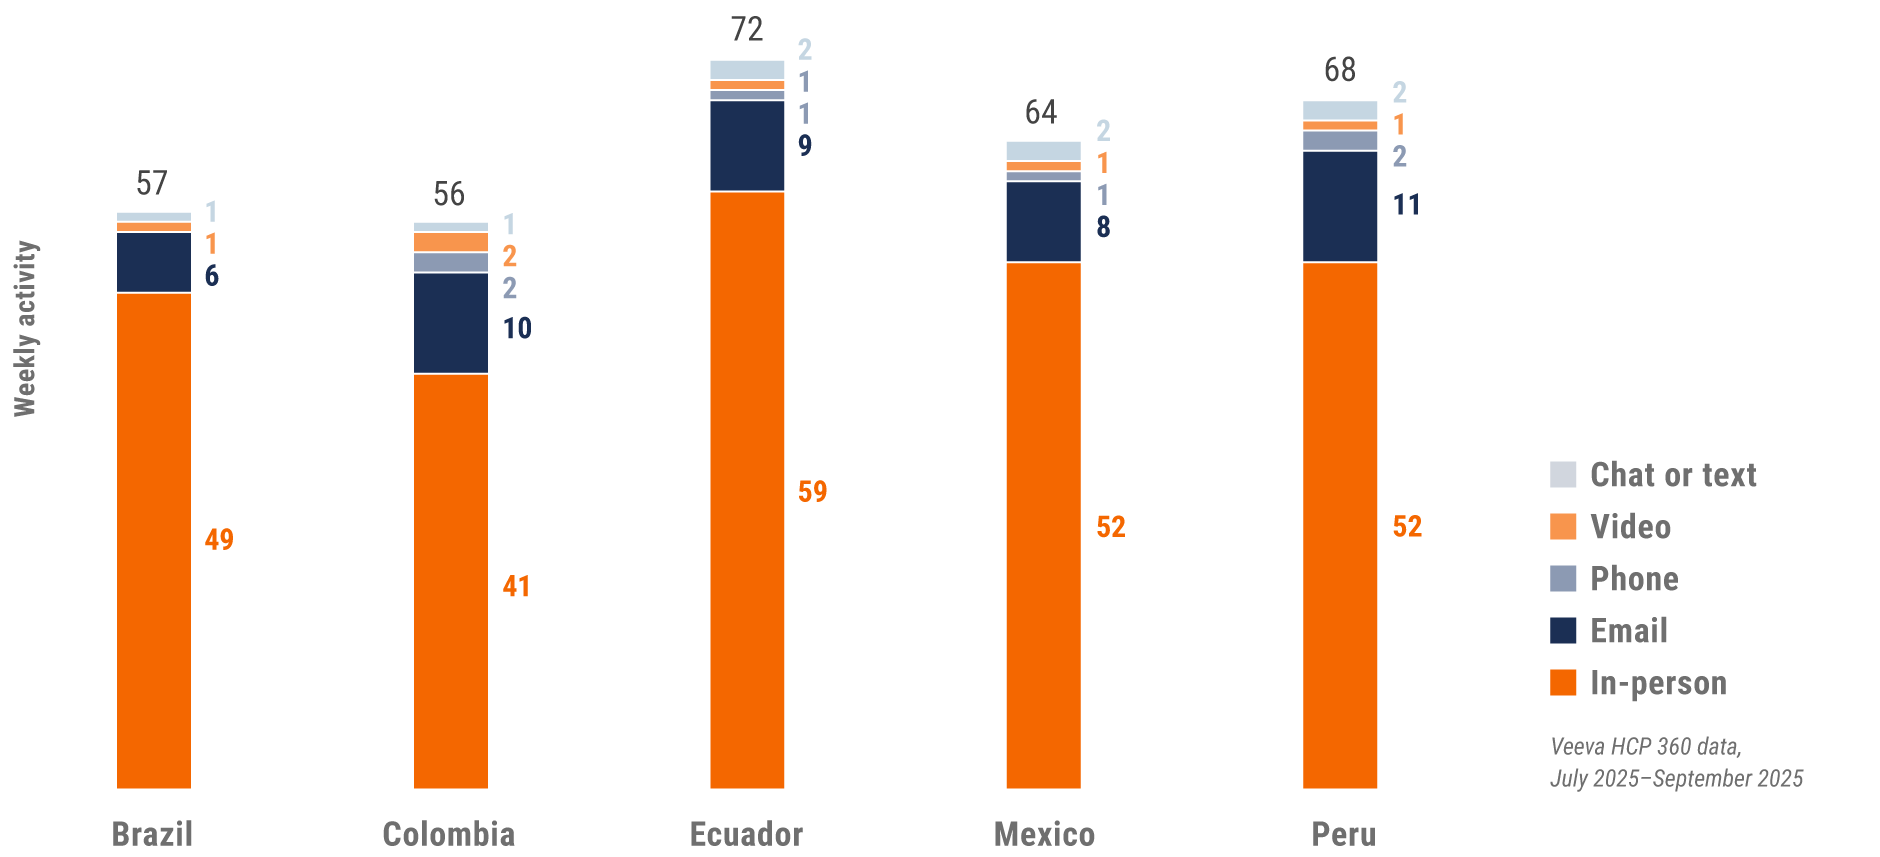
Latin America engagement quality Consolidation of key quality metrics
Figure 28: Approved email volume, Latin America
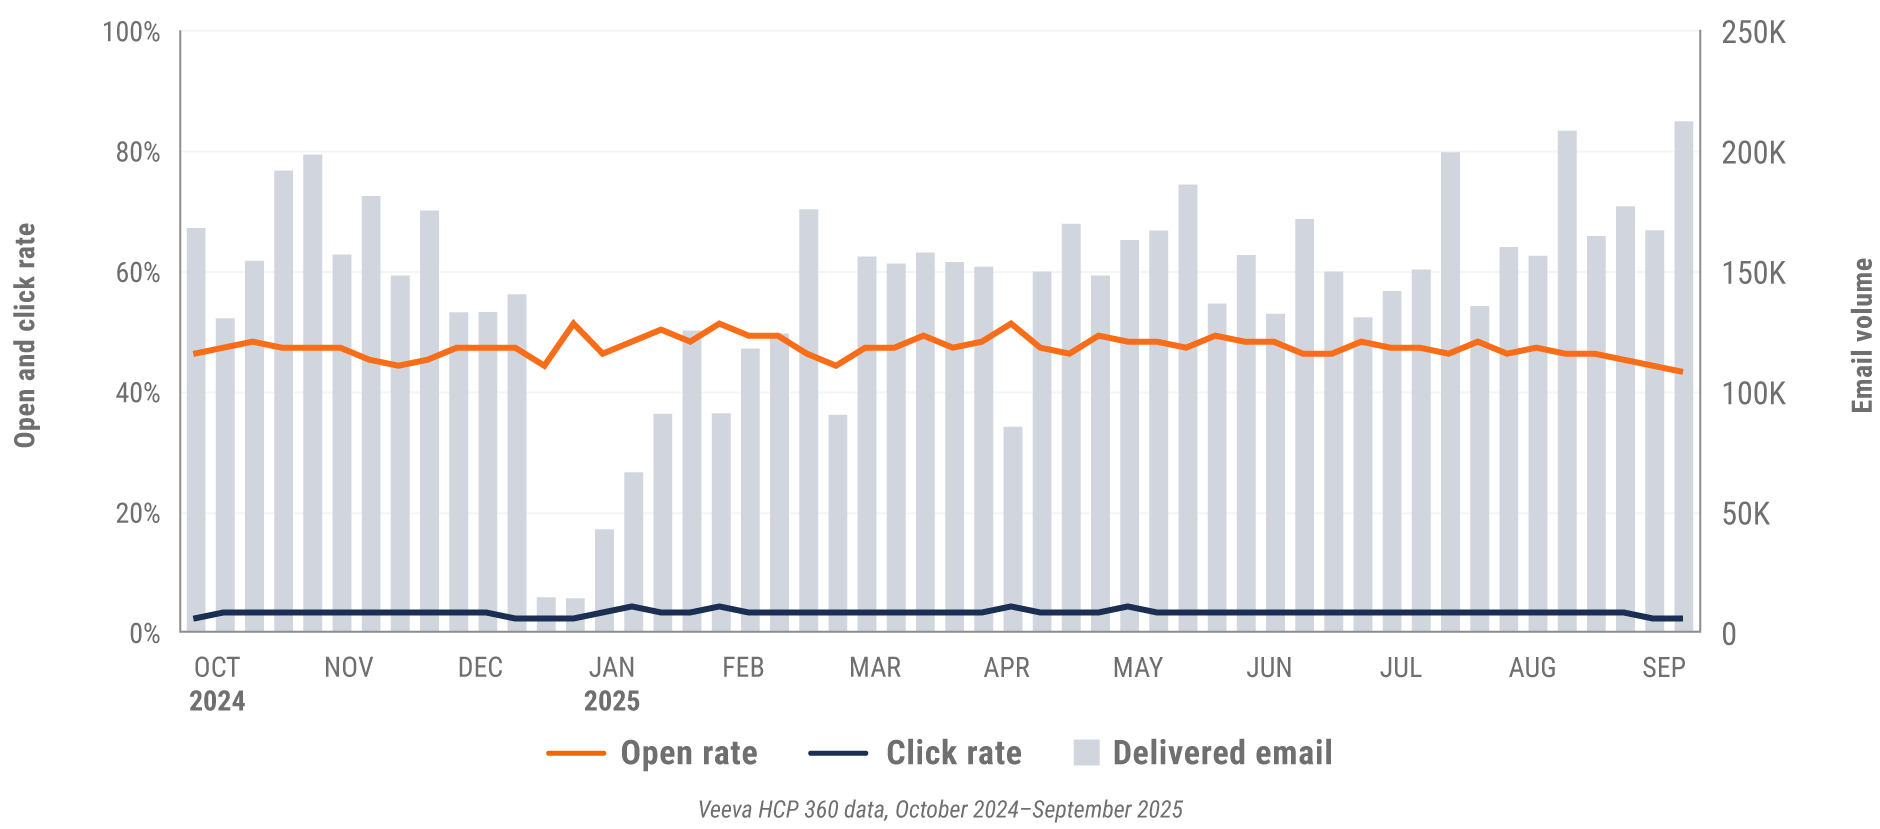
Figure 29: Content usage by channel, Latin America
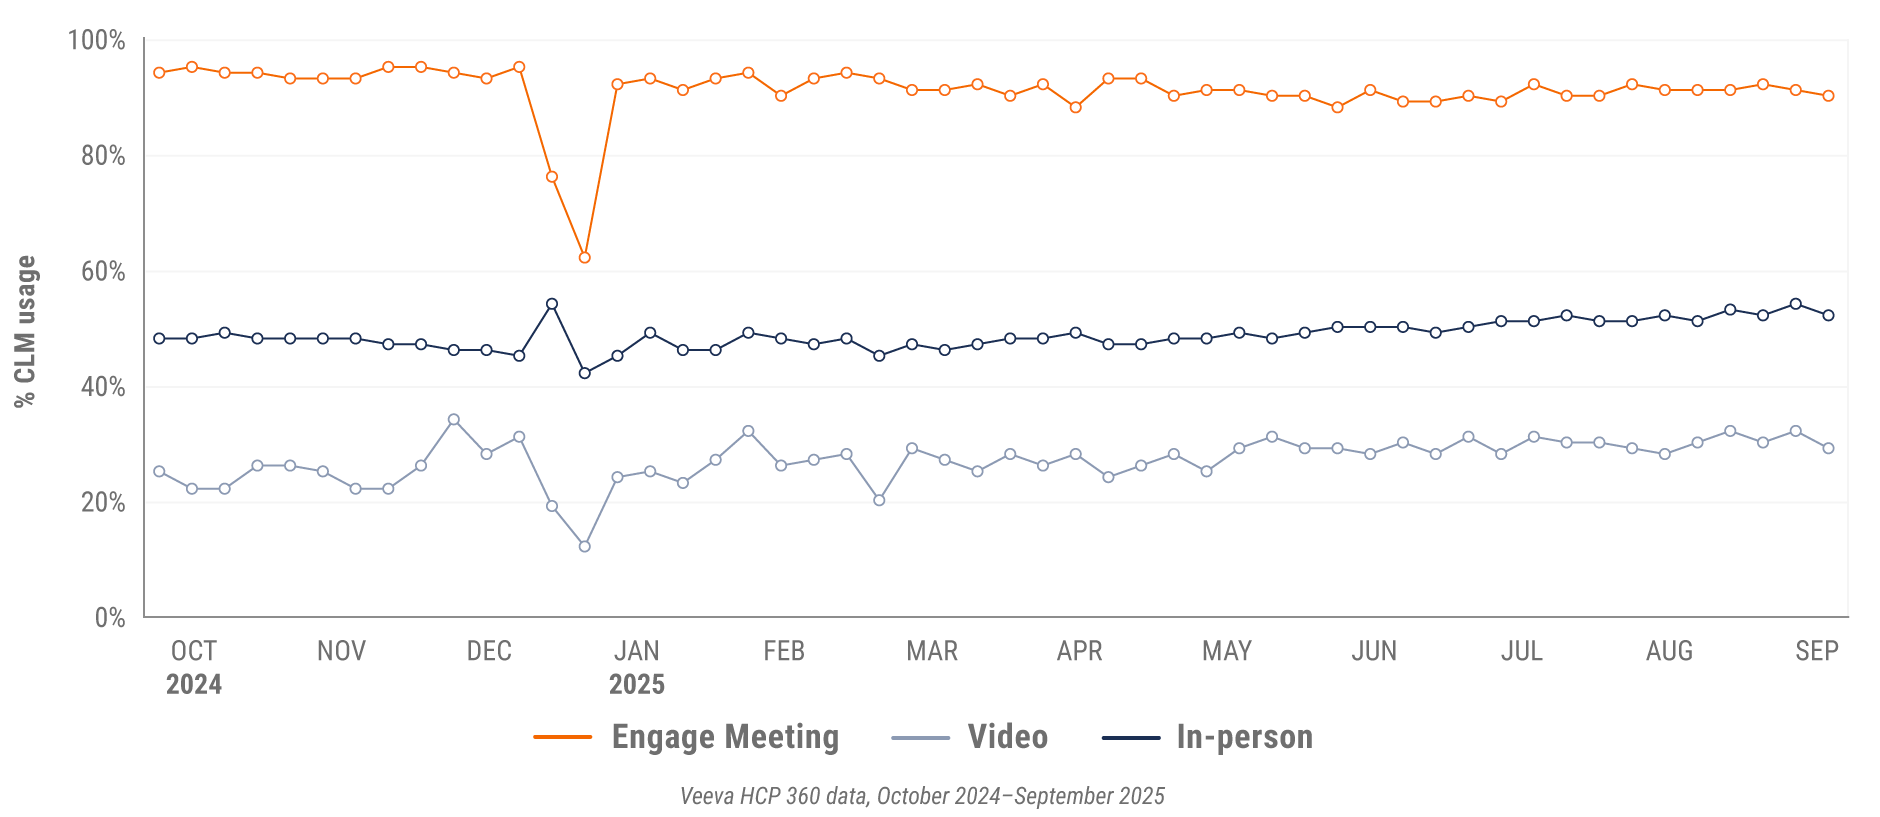
Figure 30: Veeva CRM Engage meeting duration, Latin America

Appendix: Data dictionary
Metric definitions
- Channel mix evolution over time: Weekly Veeva CRM activity volume broken down by the channel of engagement (in-person, phone, video, email, chat or text)
- Channel mix: Total Veeva CRM activity volume broken out by engagement channel percentage, calculated using percent change during the specified period
- Weekly activities per user: The average weekly number of Veeva CRM activities submitted per number of users active in Veeva CRM
- Approved email volume: The average weekly volume of approved emails sent via Veeva CRM, calculated using percent change during the specified period
- Email open rate: Percentage of approved emails opened at least once out of all approved emails sent via Veeva CRM
- Email click rate: Percentage of approved emails clicked at least once out of all approved emails sent via Veeva CRM
- In-person % CLM usage: Percentage of in-person engagements that leveraged content in Veeva CRM
- Video % CLM usage: Percentage of video engagements that leveraged content in Veeva CRM
- Veeva CRM Engage meeting % CLM usage: Percentage of Veeva CRM Engage meetings that leveraged content in Veeva CRM
- Veeva CRM Engage meeting duration: The average duration of Veeva CRM Engage meetings in minutes
Engagement channel definitions
- In-person: Submitted calls with a CRM Standard Metrics call channel value of ‘in-person’
- Phone: Submitted calls with a CRM Standard Metrics call channel value of ‘phone’
- Video: Veeva CRM Engage calls and video calls via other platforms that are then recorded as calls in Veeva CRM with a Standard Metrics call channel value of ‘video’
- Email: Approved emails and emails sent via other platforms that are then recorded as calls in Veeva CRM with a Standard Metrics call channel value of ‘email’
- Chat or text: Submitted calls with a CRM Standard Metrics call channel value of ‘chat or text’
Region definitions
- Global: All markets globally except China
- Europe: Albania, Andorra, Armenia, Aruba, Austria, Azerbaijan, Belarus, Belgium, Bermuda, Bosnia and Herzegovina, Bulgaria, Croatia, Cyprus, Czech Republic, Denmark, Estonia, Finland, France, French Polynesia, Georgia, Germany, Greece, Greenland, Guadeloupe, Guernsey, Hungary, Ireland, Italy, Jersey, Latvia, Lithuania, Luxembourg, Macedonia, Malta, Martinique, Republic of Moldova, Monaco, Montenegro, Netherlands, New Caledonia, Norway, Poland, Portugal, Romania, Serbia, Slovakia, Slovenia, Spain, Sweden, Switzerland, Ukraine, United Kingdom
- Asia: Australia, Bangladesh, Bhutan, Brunei Darussalam, Cambodia, Cocos (Keeling) Islands, Indonesia, Japan, Kazakhstan, Republic of Korea, Kyrgyzstan, Malaysia, Mongolia, Myanmar, Nauru, Nepal, New Zealand, Philippines, Samoa, Singapore, Solomon Islands, Sri Lanka, Taiwan, Tajikistan, Thailand, Turkmenistan, Uzbekistan, Vietnam
- Latin America: Antigua and Barbuda, Argentina, Bahamas, Barbados, Belize, Bolivia, Brazil, Chile, Colombia, Costa Rica, Cuba, Dominican Republic, Ecuador, El Salvador, Guatemala, Guyana, Haiti, Honduras, Jamaica, Mexico, Nicaragua, Panama, Paraguay, Peru, Trinidad and Tobago, Uruguay, Venezuela
Methodology
The Veeva HCP 360 Trends Report is a quarterly industry benchmark for global and regional healthcare professional (HCP) engagement across the life sciences industry. The findings are based on:
- Approximately 600 million annual global field activities captured in Veeva CRM and Veeva CRM Engage.
- Marketing effectiveness data from Veeva Crossix. Crossix connects anonymized health data on 300+ million patients to media data to measure the impact of direct-to-consumer and HCP marketing investments in the U.S.
- Anonymous patient longitudinal claims data from Veeva Compass Patient covering dispensed prescriptions, procedures, and diagnoses from 300+ million patients.
- 4+ million profiles containing publications, clinical trials, conferences, associations, guidelines, grants, payments, social media, news mentions, and patient mix by disease and drug class from Veeva Link Key People in 85+ countries and all major therapeutic areas.
- Global reference data of HCPs, healthcare organizations, and affiliations from Veeva OpenData, containing addresses, emails, specialties, demographics, and compliance data (license information and industry identifiers) in 100+ countries.
The Veeva HCP 360 Trends Report delivers insights that inform the industry and help field teams align their strategy to key market trends for improved commercial success. The global Veeva Business Consulting team also helps customers inform their strategies using industry benchmarking with Veeva HCP 360 data.