Industry Report
Veeva Agentic Commercial Trends Report
The Q1 Agentic Commercial Trends Report details how Commercial Evidence creates compliant, actionable insights that drive precision engagement.
Commercial Evidence: 65% of Agentic Call Reports Reveal Actionable Treatment Barriers
Assessing the impact of agentic AI in detecting intent signals and identifying barriers
While field and digital strategies now support complex treatment launches, rigid data capture and static digital experiences still obscure critical customer insights.
The implementation of agentic commercial capabilities addresses this intelligence gap. By utilizing AI to capture and evaluate unstructured, compliant text, companies can generate empirical 'Commercial Evidence' — transforming qualitative field and digital interactions into scalable, actionable data.
This shift yields a measurable return on AI (ROAI) across digital and field channels:
- 65% of compliant, free-text field notes captured with Agentic Call Reports identify actionable treatment barriers not captured by traditional call reports.
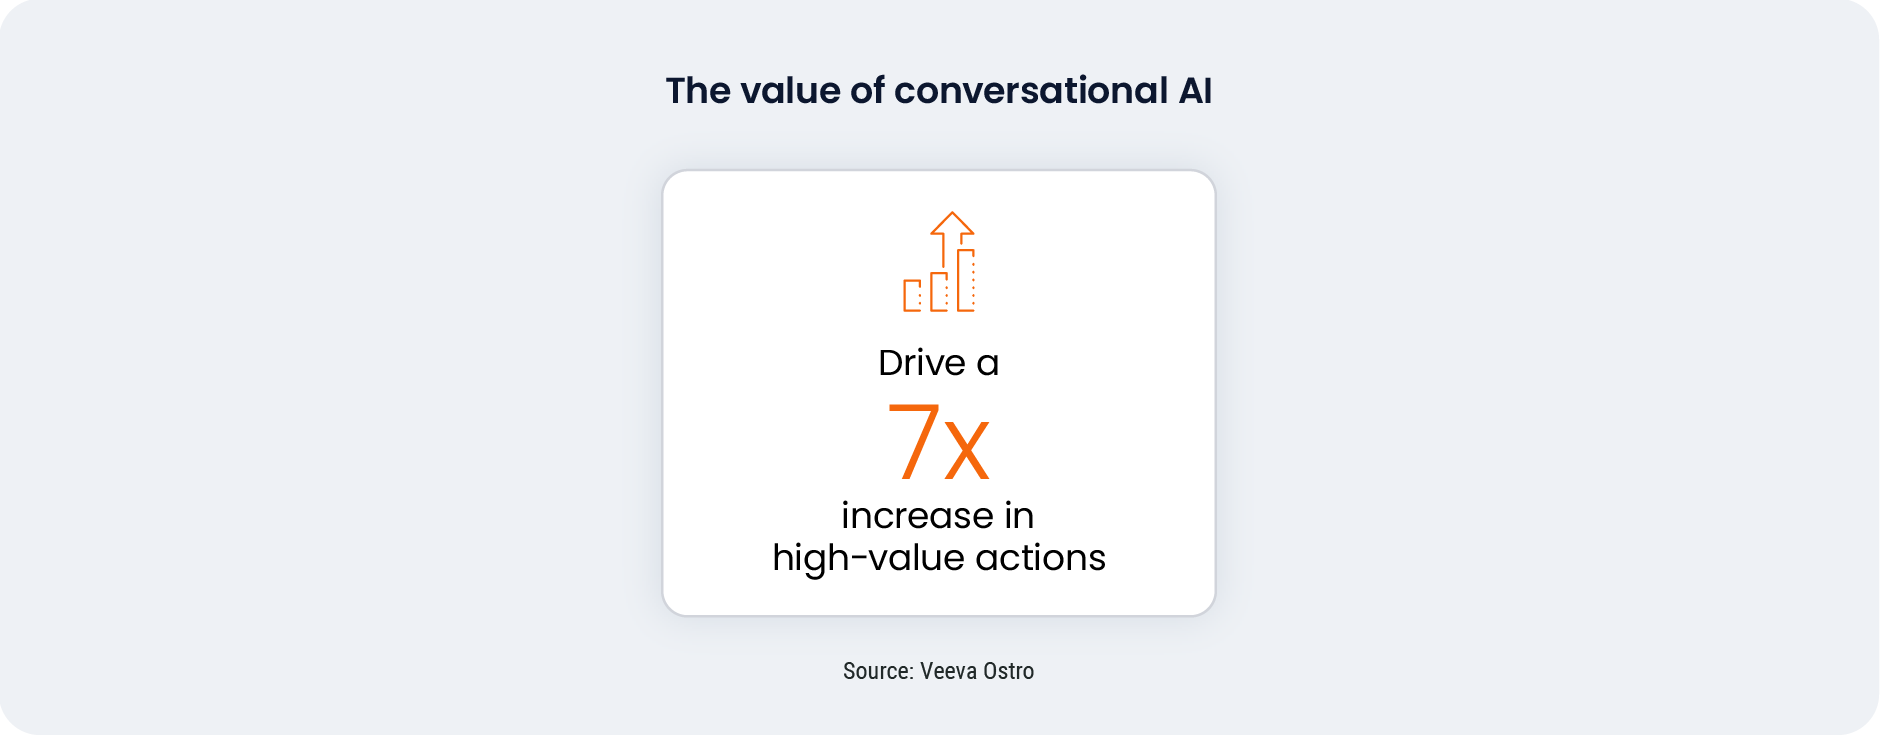
- Conversational AI on brand sites delivers the right resources to patients and HCPs, driving a 7x increase in high-value actions.
Generating Commercial Evidence removes systemic blind spots and drives precision engagement. This shift gives biopharmas a decisive execution advantage through focused AI that delivers measurable impact at scale.

Dan Rizzo
VP, Global Head of Business Consulting

Agentic Call Report identifies treatment barriers
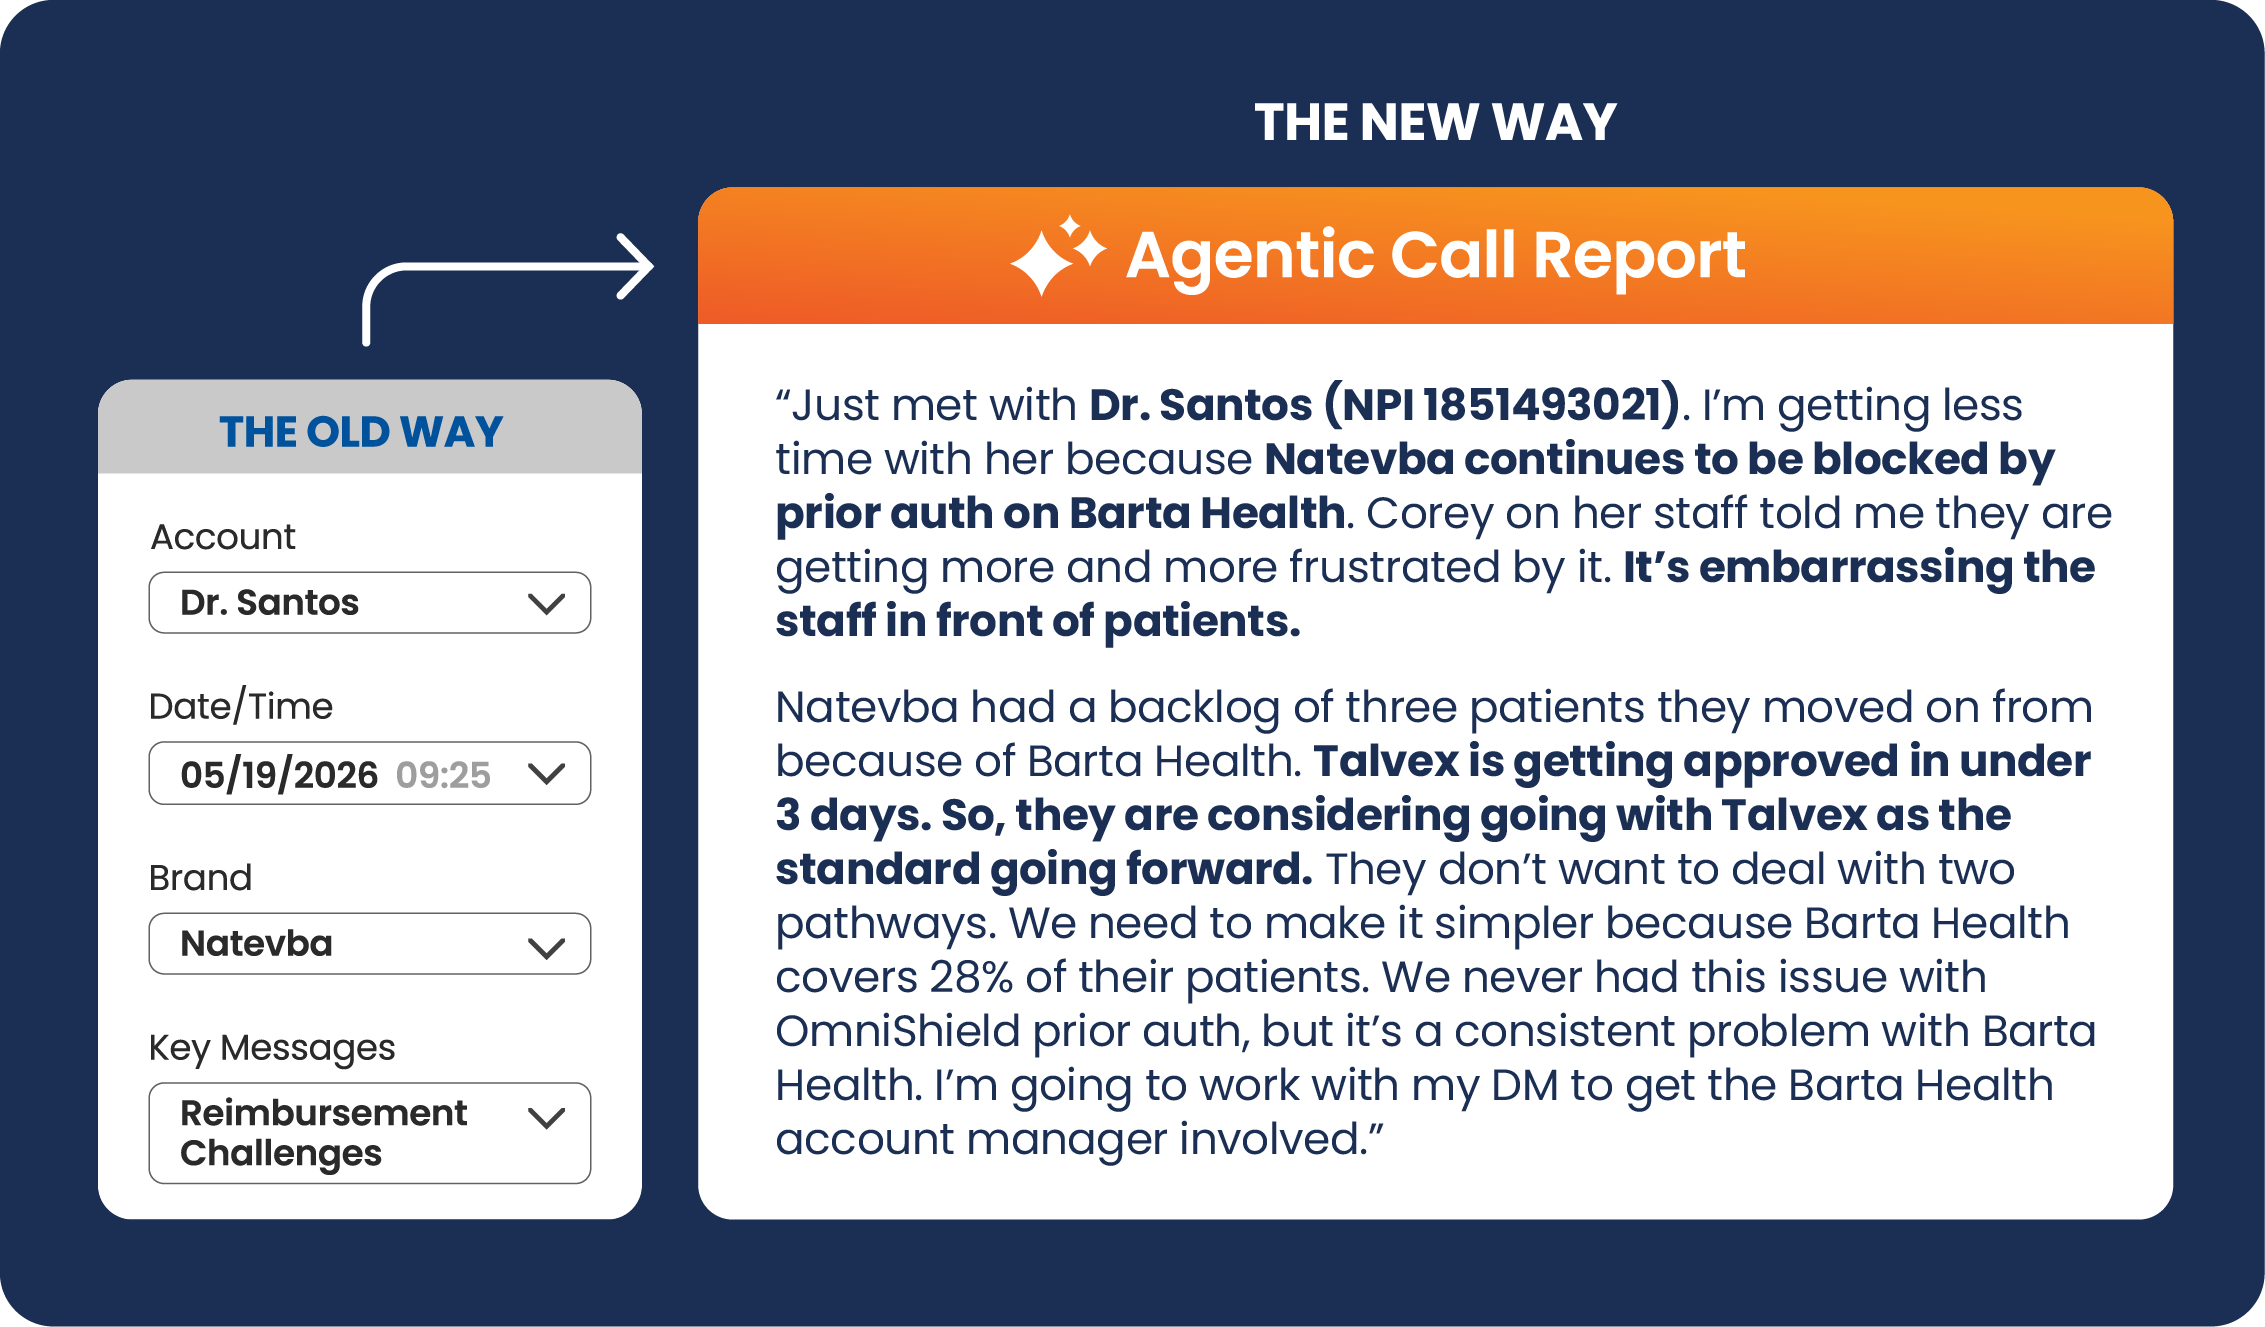
Traditional call reports document tactical basics but lack critical texture and context (the why and why not) because limited fields and picklists cannot capture narrative insights.
Capturing and synthesizing field conversations and observations creates Commercial Evidence — compliant, actionable intelligence that allows field teams to address specific therapeutic barriers with greater operational precision.
Commercial Evidence generated by Agentic Call Reports that process unstructured text and verbal summaries shows that 65% of field interactions contain detailed barriers to treatment that traditional reporting can’t see.
"Agentic call reporting delivers value beyond capturing detailed call notes. The insights — segmentation, validation of campaigns, and more — inform our commercial strategy."
Conversational AI optimizes content strategies and informs field insights
Conversational AI is fundamentally changing customer engagement. Compliant chat on brand sites now delivers instant answers to patients and HCPs while capturing the questions they are asking. Accelerating access to information drives an immediate increase in high-value actions (e.g., sample requests, coverage verification, co-pay support, provider or pharmacy locators).
Providing answers and resources at the moment of need translates to a clear return on AI. For example, one specialty medicine brand using precision, conversational AI is driving a 7x increase in high-value actions compared to traditional web experiences without compliant conversational AI.
Conversational AI generates Commercial Evidence by revealing exactly what HCPs and patients are asking so brands can proactively close gaps in content and the customer journey, shape broader brand and communication strategies, and ensure field reps know exactly what is top-of-mind for physicians.
Establishing the brand as the primary source of information is more critical than ever. Research evaluating health information provided by five popular public-facing chatbots (Gemini, DeepSeek, Meta AI, ChatGPT, and Grok) shows that 50% generate “problematic” answers and 20% are harmful or ineffective.
By exclusively referencing medical, legal, and regulatory (MLR)-approved content, precision conversational AI delivers 100% compliant answers and eliminates standard generative AI information risks.
"Veeva Ostro delivers the Commercial Evidence needed to uncover hidden friction points. For us, it revealed that HCPs required better access to surgical wristbands used to ensure safer administration of our drug, an unmet need a traditional brand website would have missed."
Precision and personalization to deliver ROAI
Evolving field roles
Field teams are shifting from broad informational outreach to targeted problem-solving. By using Commercial Evidence to see exactly where doctors and patients face barriers, companies deploy specialized roles with greater precision:
- Field Medical: Address granular requests for deep scientific data, off-label context, and clinical trial nuances with targeted accuracy.
- Market Access: Find and resolve local insurance barriers, prior authorization friction, or co-pay assistance constraints.
- HEOR Specialists: Communicate real-world economic value directly to institutional payers and health systems using Commercial Evidence relevant to their specific patient populations.
Content optimization and focused journeys
Commercial Evidence allows brands to proactively address gaps in the customer journey using actual user questions. Content delivery is moving from slow, quarterly planning cycles to continuous updates that focus on providing clear, instant answers and driving key next-step actions.
Medical congresses and peer education
Commercial Evidence identifies gaps in scientific focus and communication. Instead of planning congress agendas around retrospective research, having HCPs’ precise scientific questions, adoption trends, and barriers shapes exactly what and how information is presented across events and peer networks.
Connect with Veeva Business Consulting to start generating commercial evidence and measurable outcomes from precision AI-powered field and brand engagement.
Global and Regional Trends
This report highlights global and regional field engagement trends from Veeva Agentic Commercial Trends data gathered between April 2025 and March 2026. Veeva Agentic Commercial Trends data is sourced from Veeva’s aggregated CRM activity, including field engagement stats from all instances of Veeva CRM globally. In this report, comparisons in trending charts are year over year, Q1 2025 to Q1 2026, while non-trending charts contain quarter-over-quarter comparisons, Q4 2025 to Q1 2026.
Global trends*
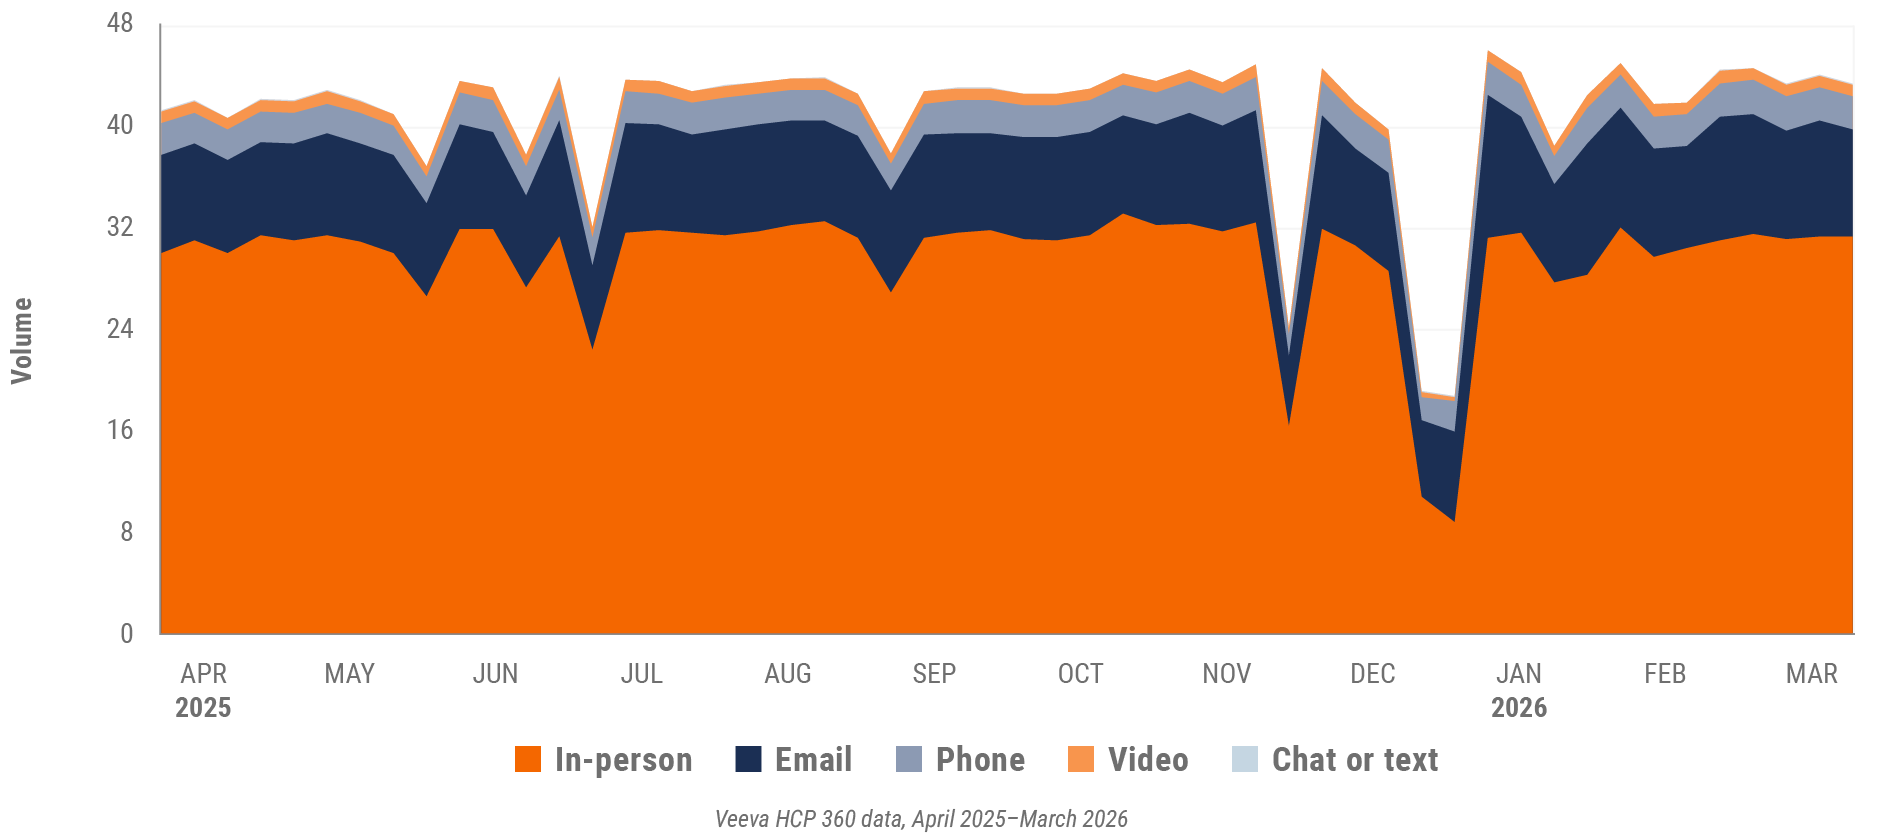
Figure 1: Channel mix evolution, global
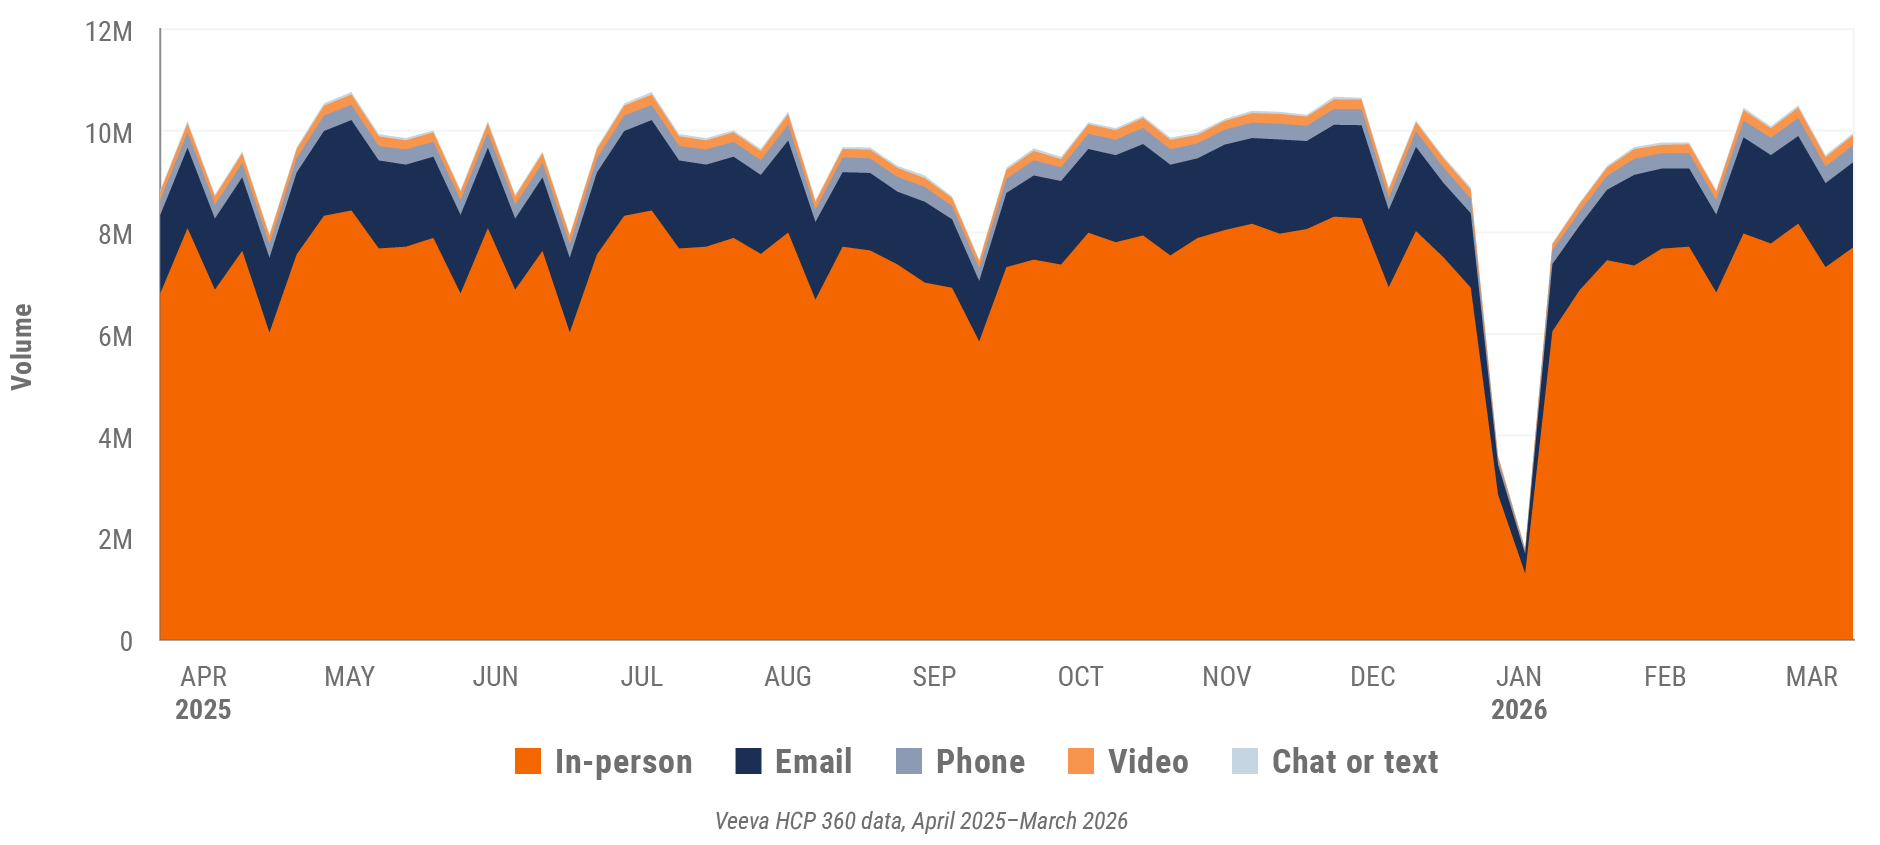
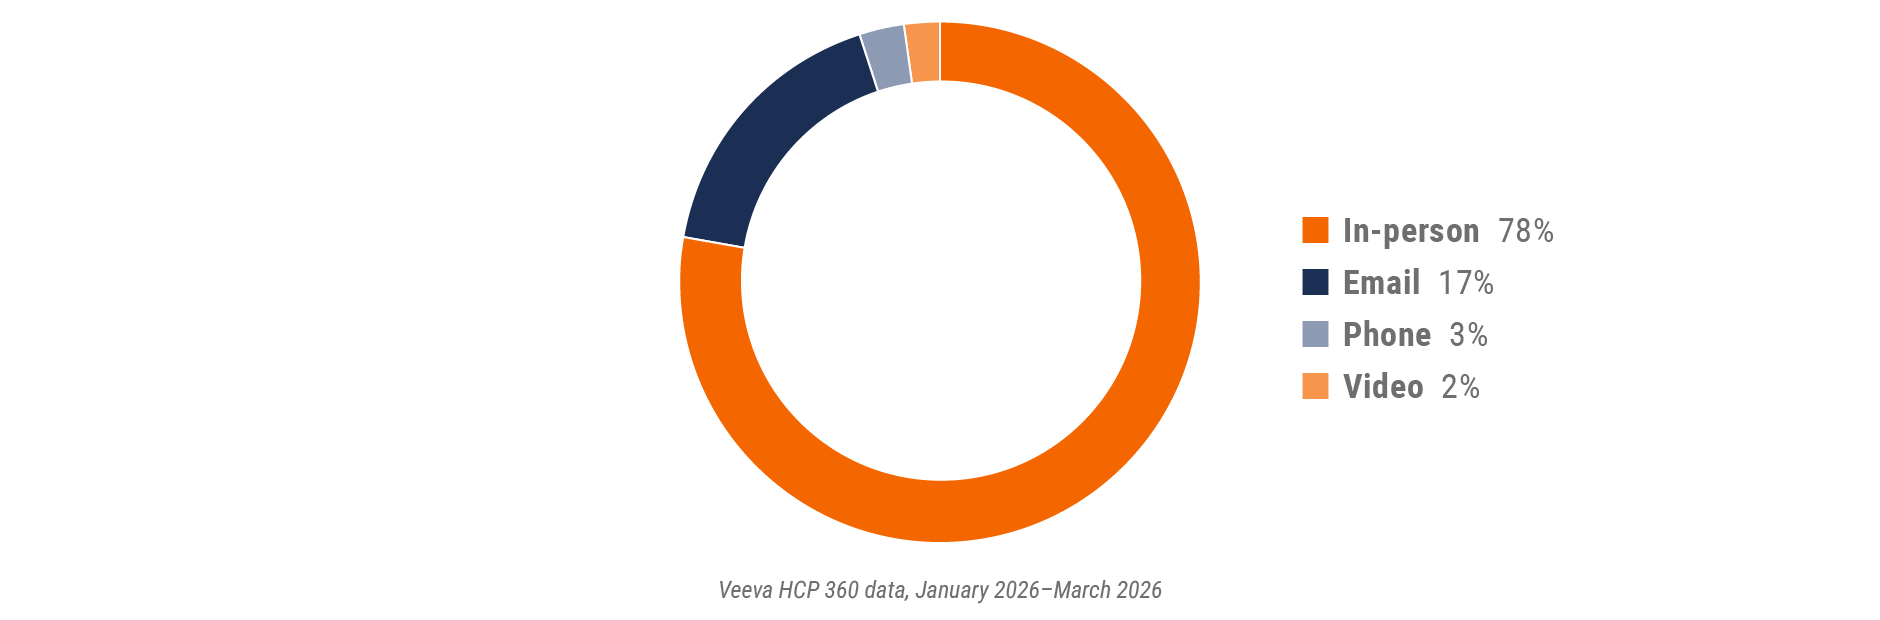
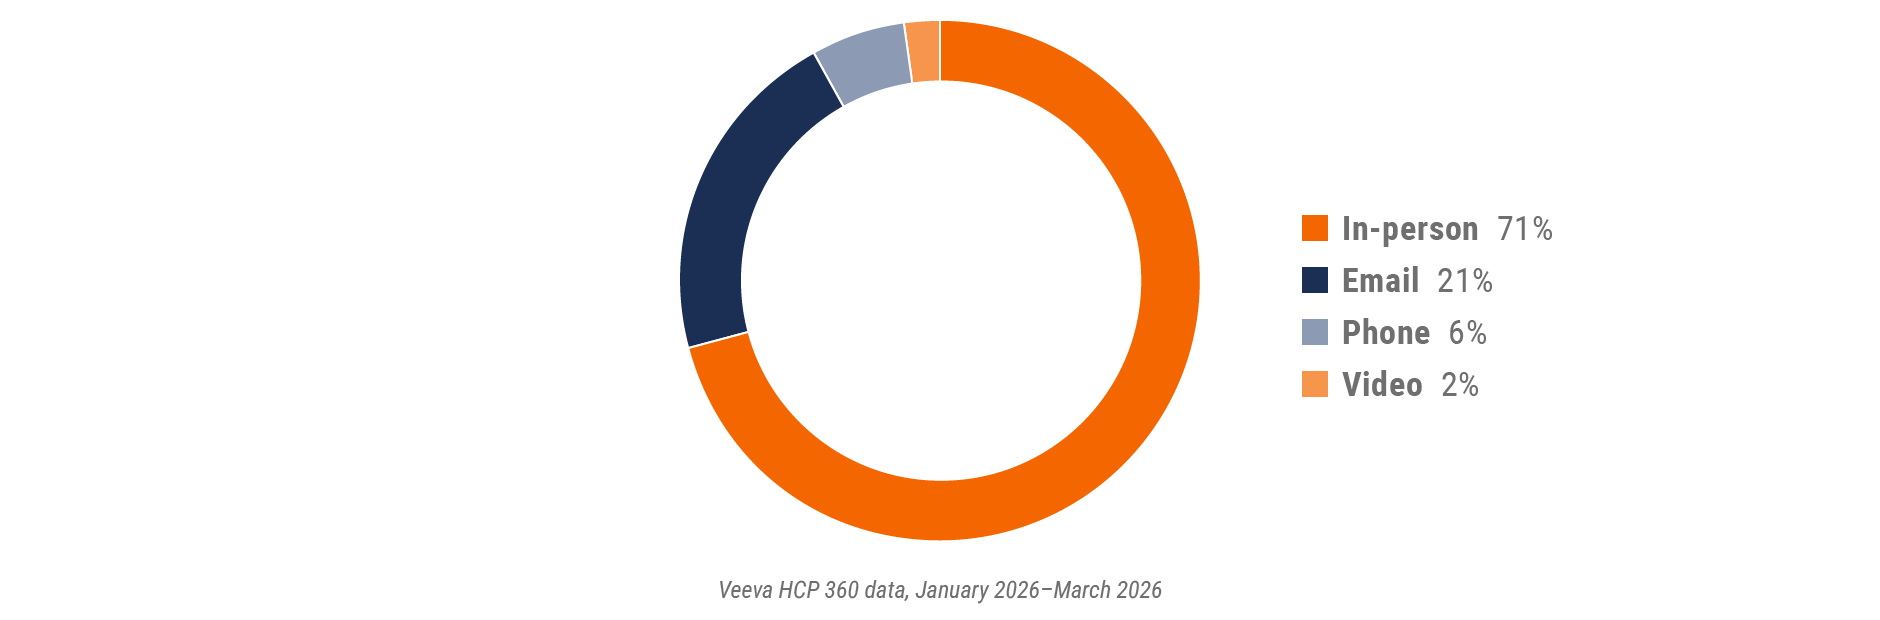
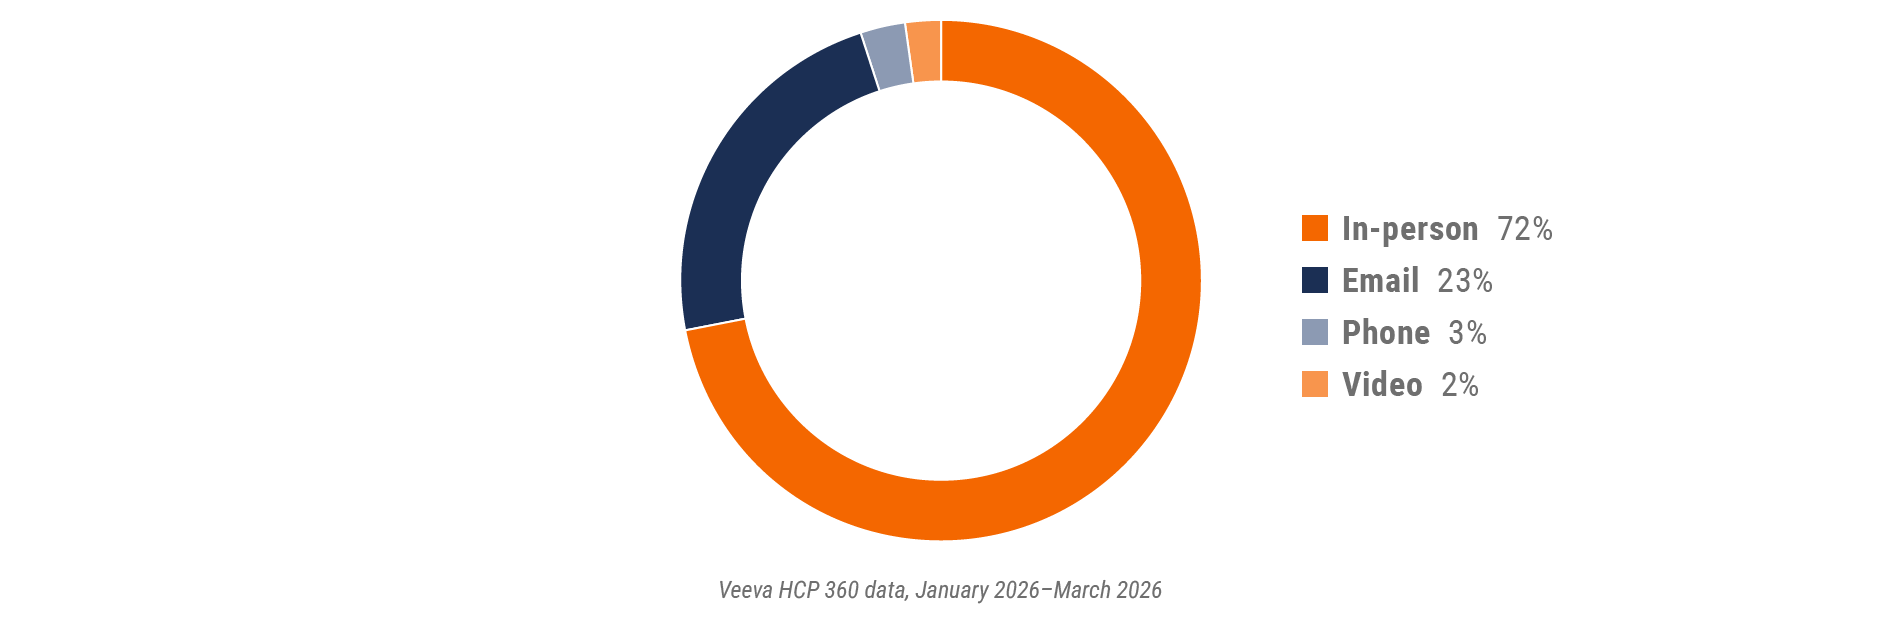
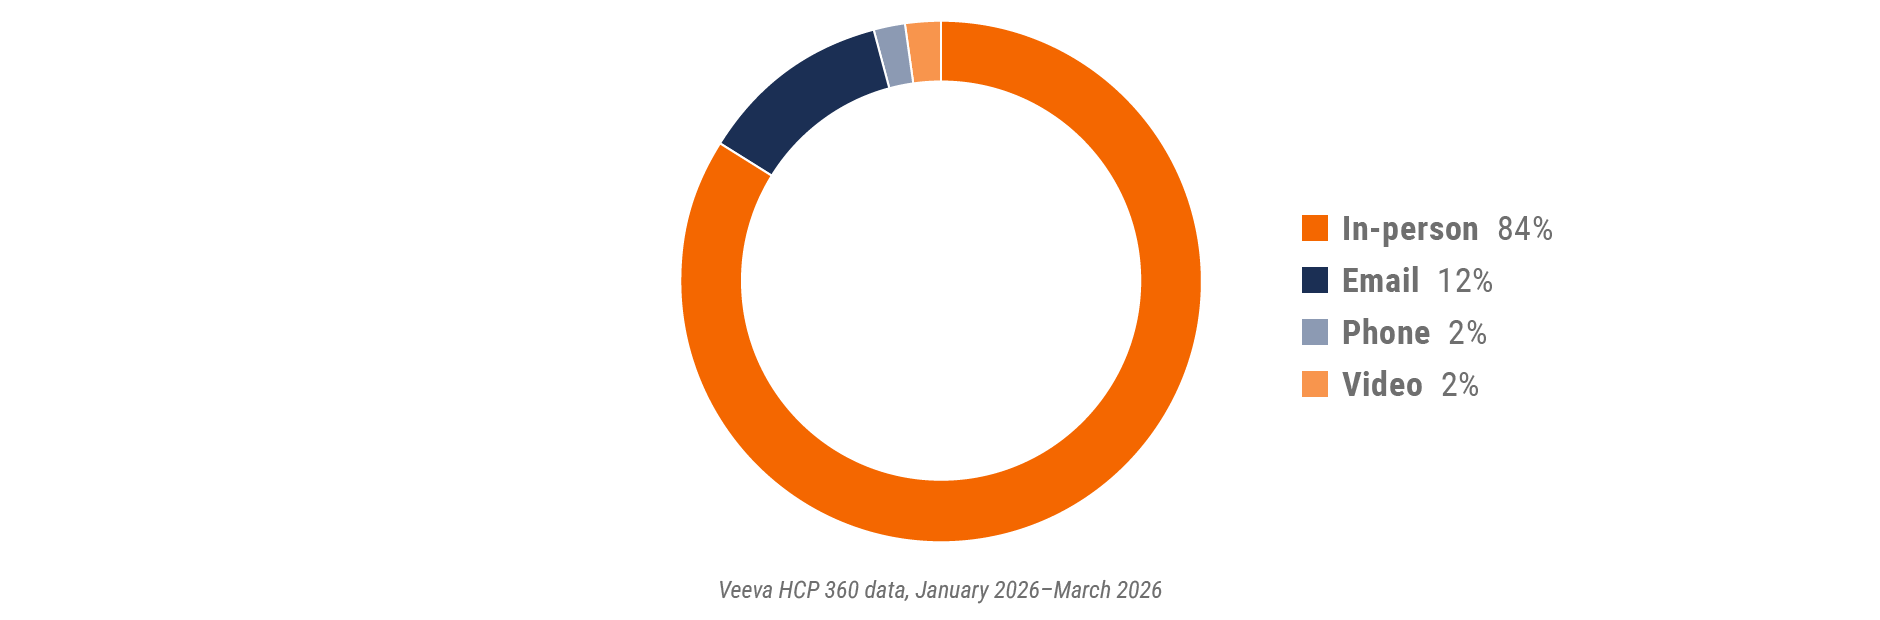
Figure 2: Channel mix, global
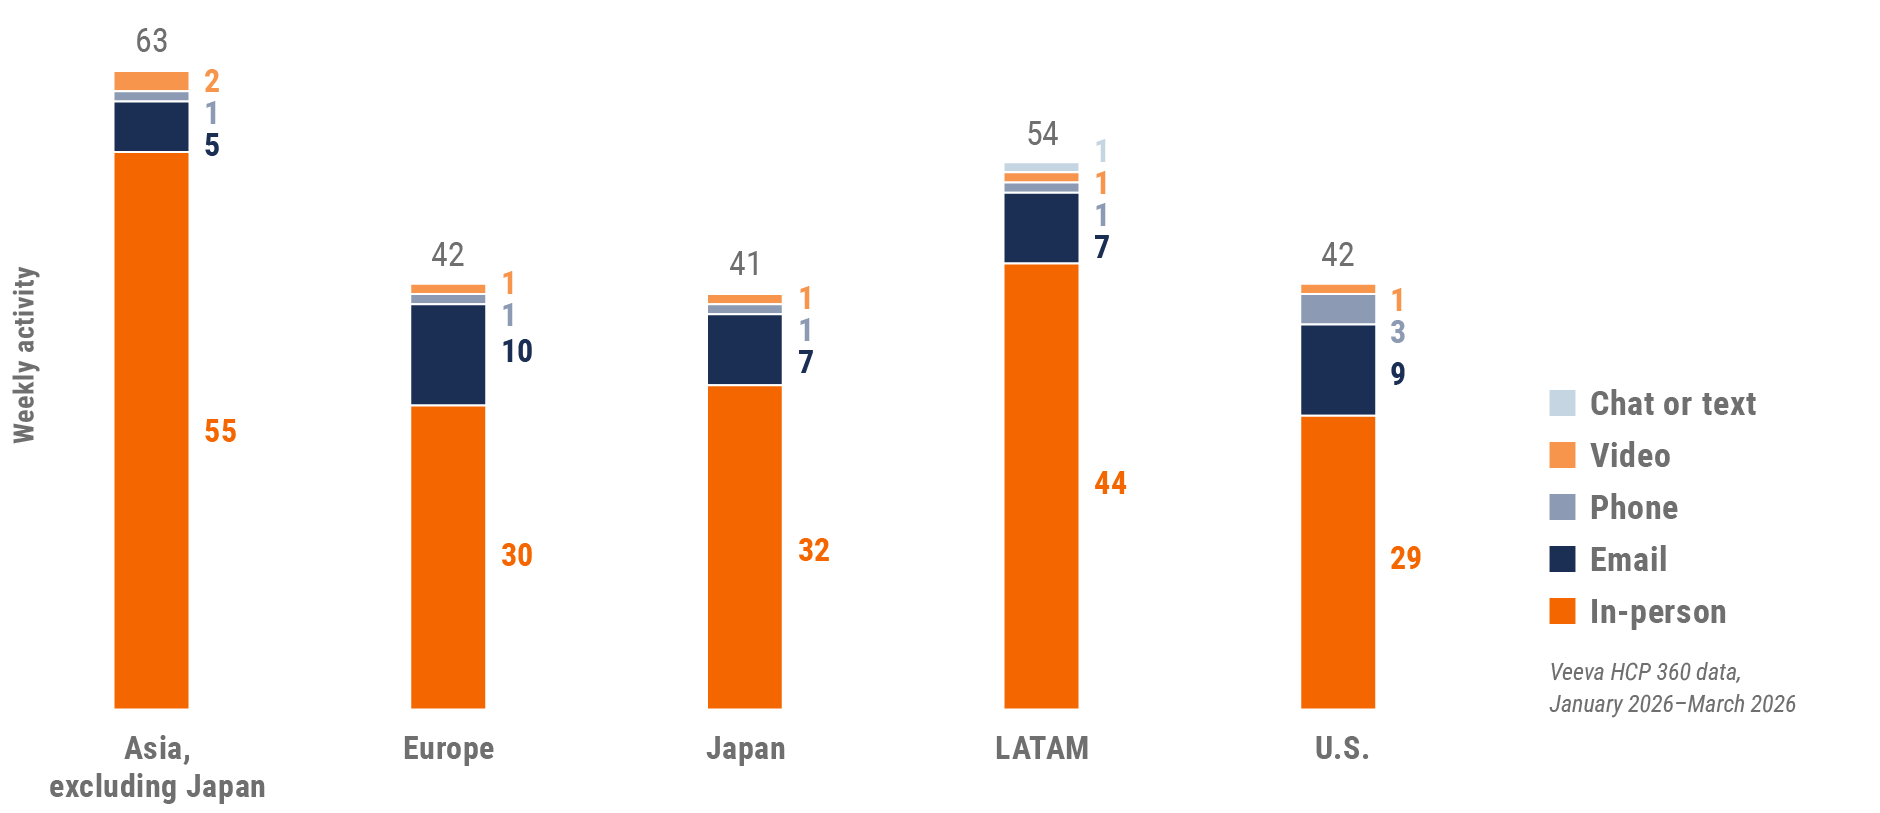
Global field team activity Weekly activity per user by engagement channel
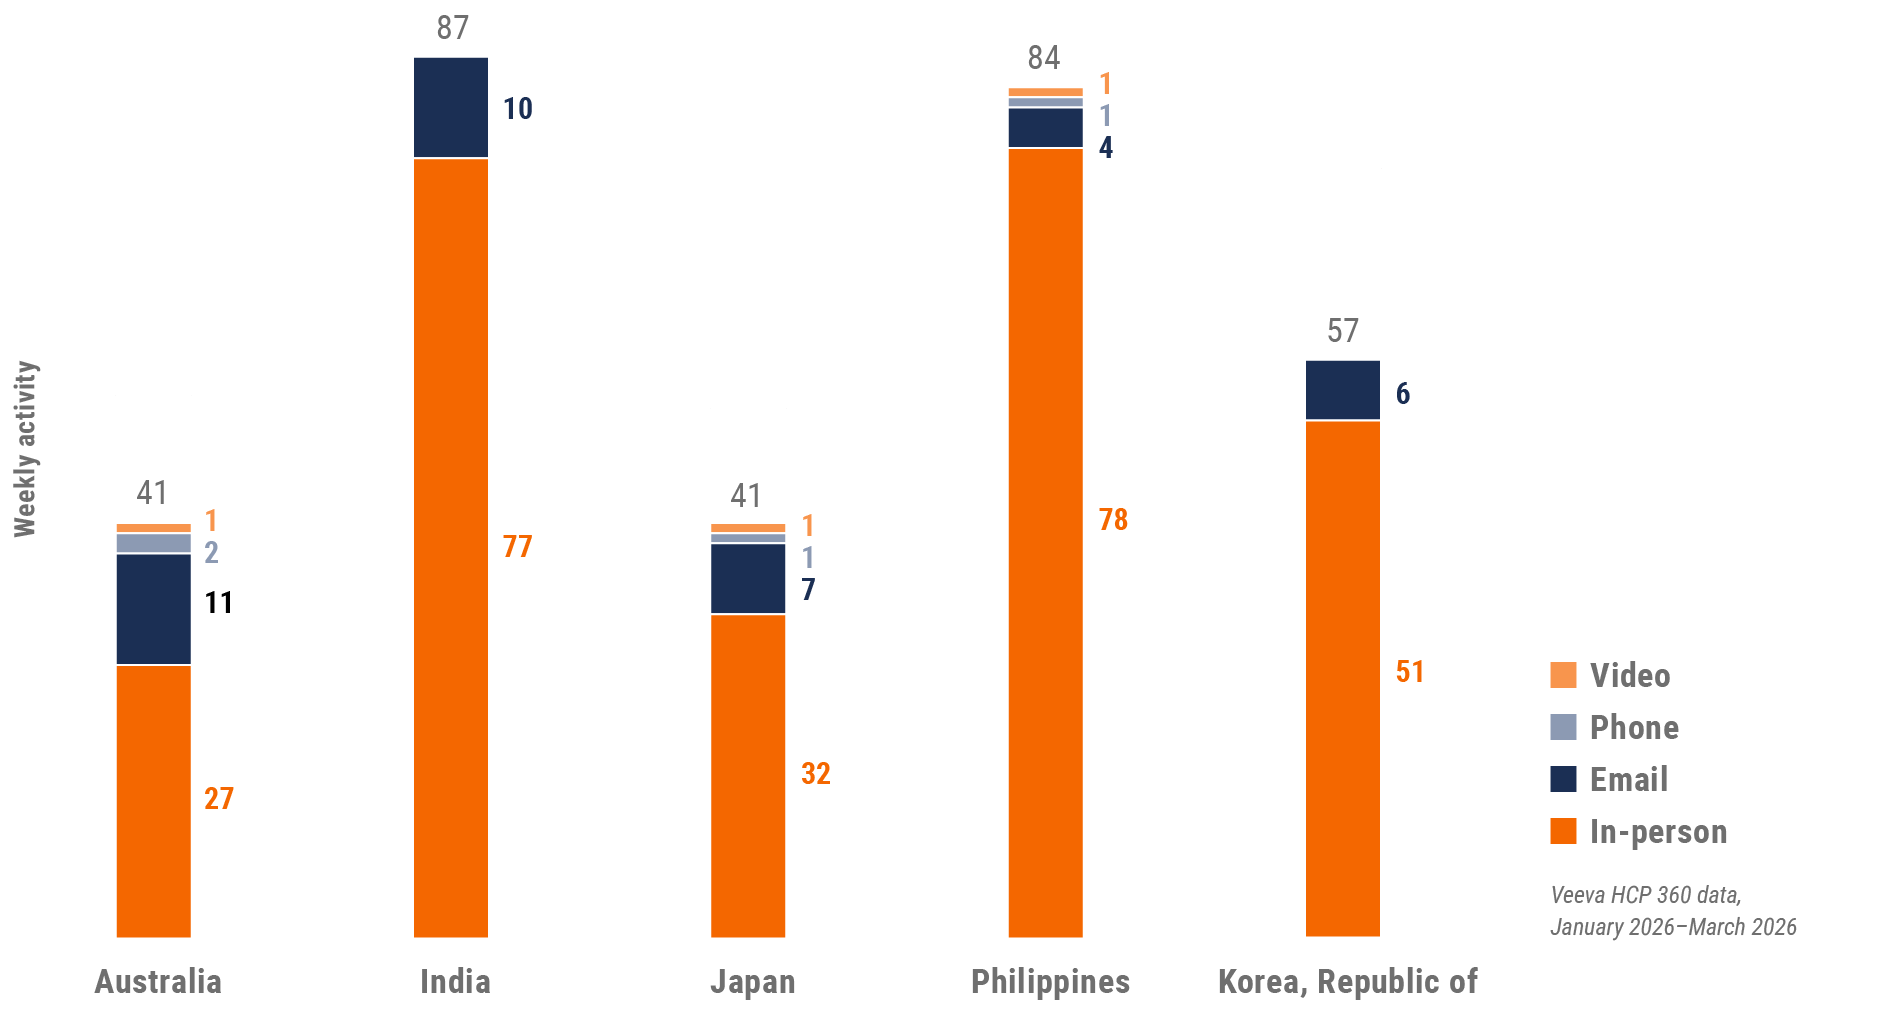
Figure 3: Activity by region, global
Global engagement quality Consolidation of key quality metrics
Figure 4: Approved email volume, global
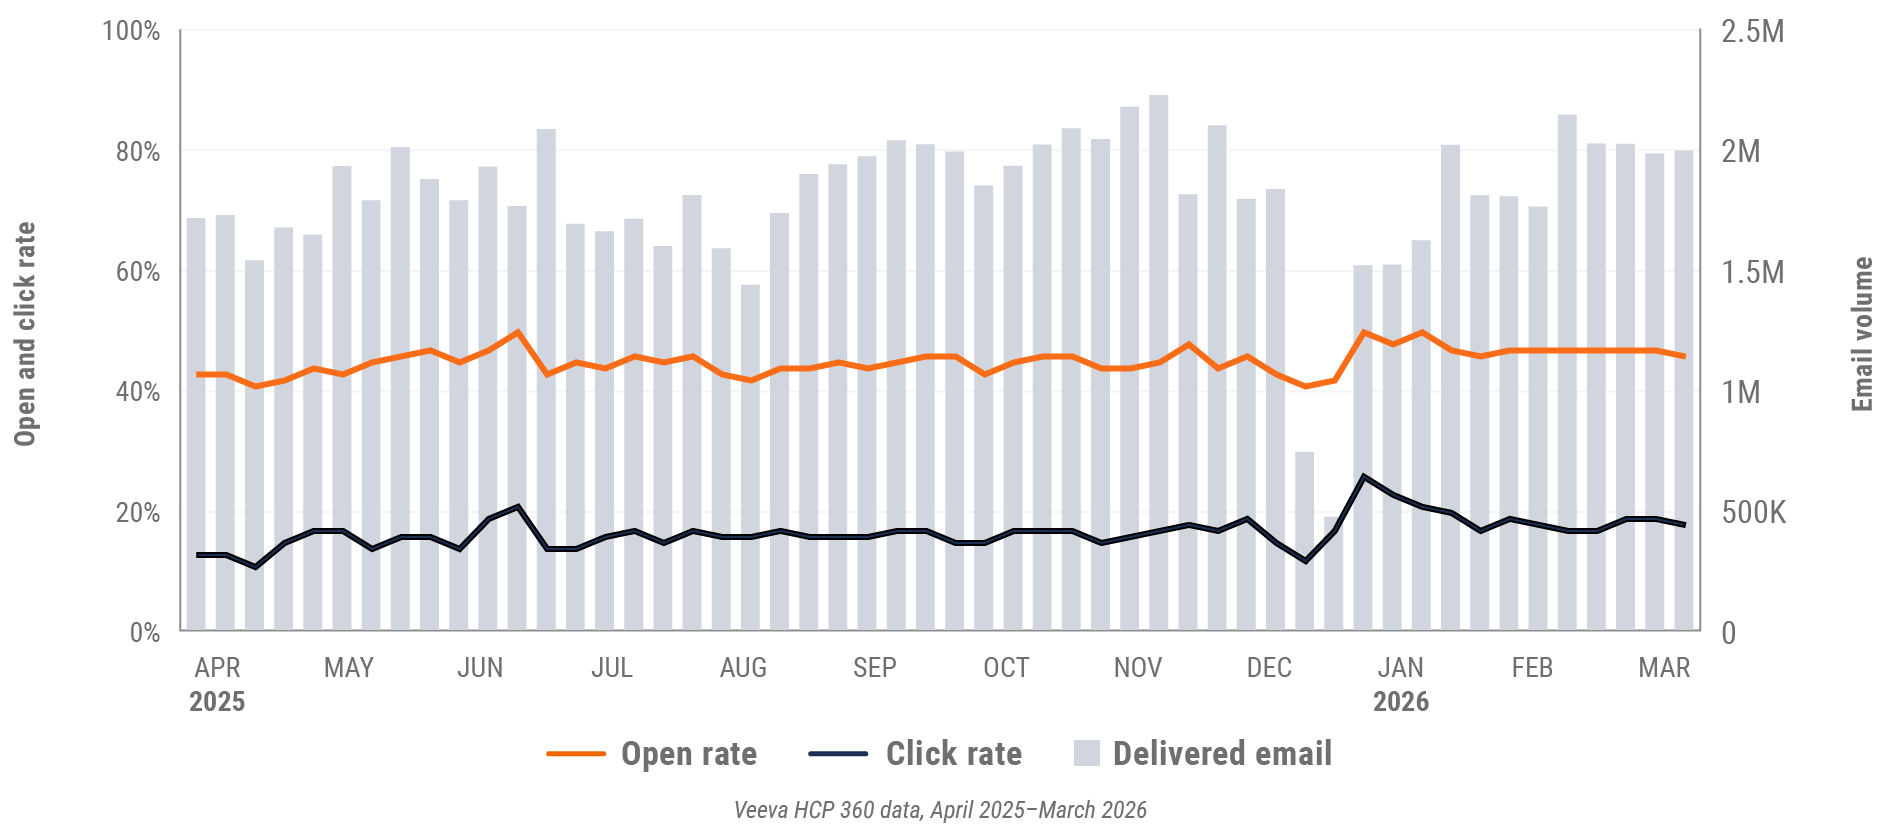
Figure 5: Content usage by channel, global

Figure 6: Veeva CRM Engage meeting duration, global

*This quarter’s global trends report omits data from China.
U.S. market trends
Figure 7: Channel mix evolution, U.S.
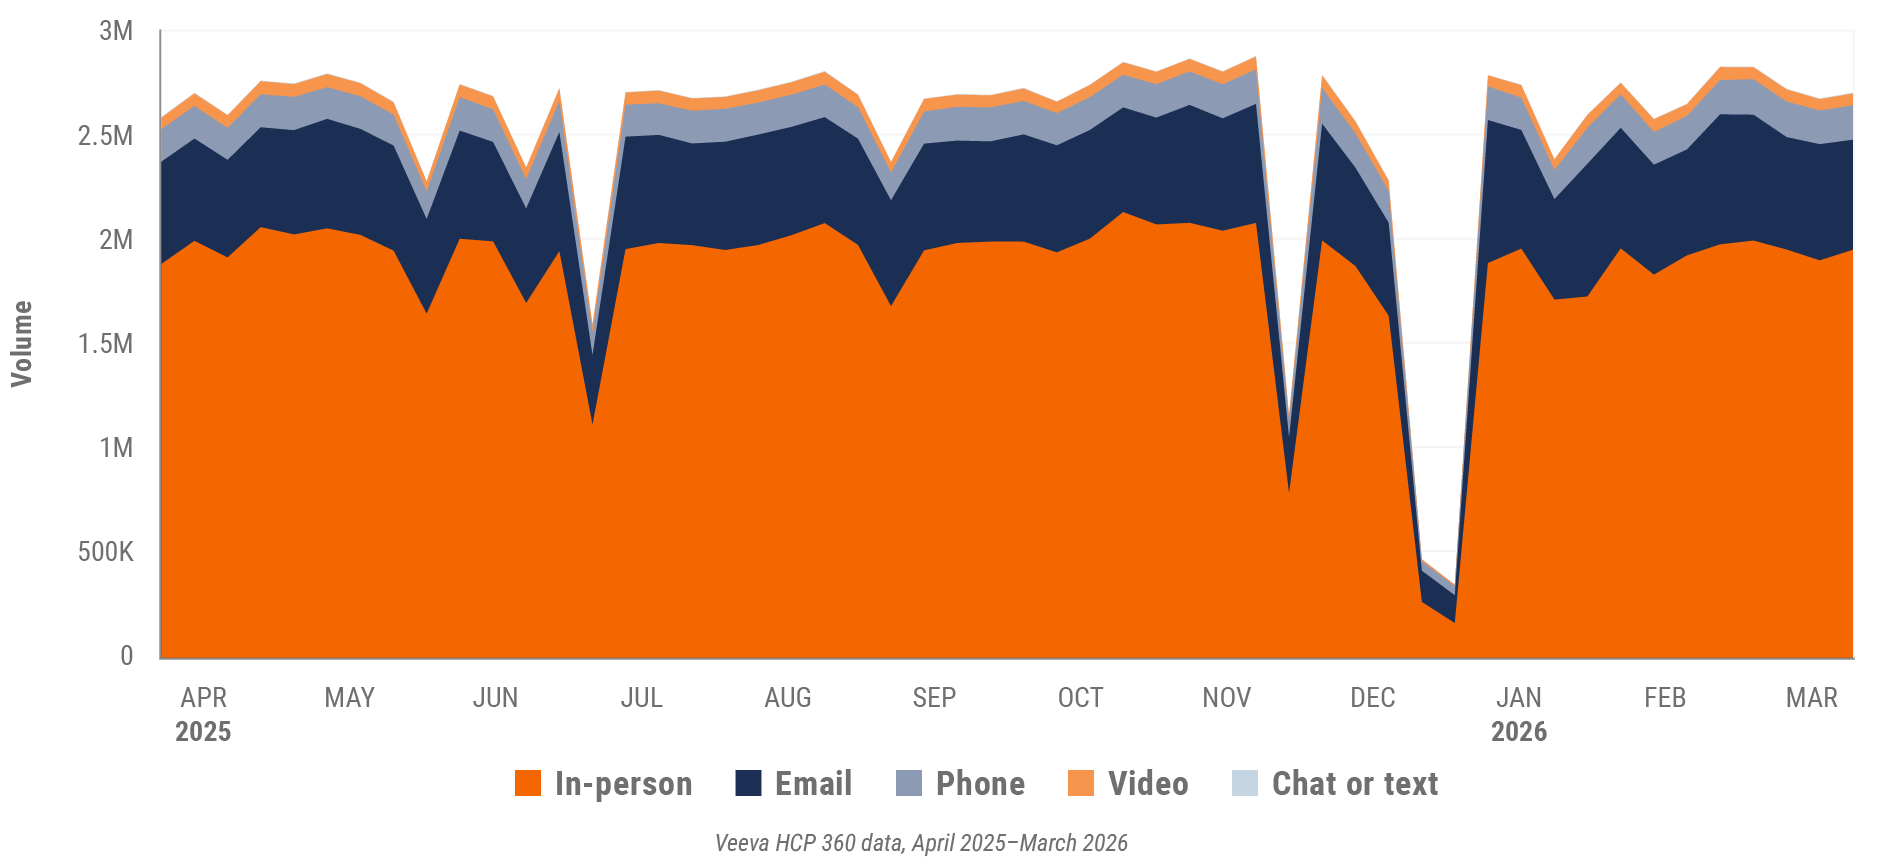
Figure 8: Channel mix, U.S.
U.S. field team activity Weekly activity per user by engagement channel
Figure 9: Activity, U.S.
U.S. engagement quality Consolidation of key quality metrics
Figure 10: Approved email volume, U.S.
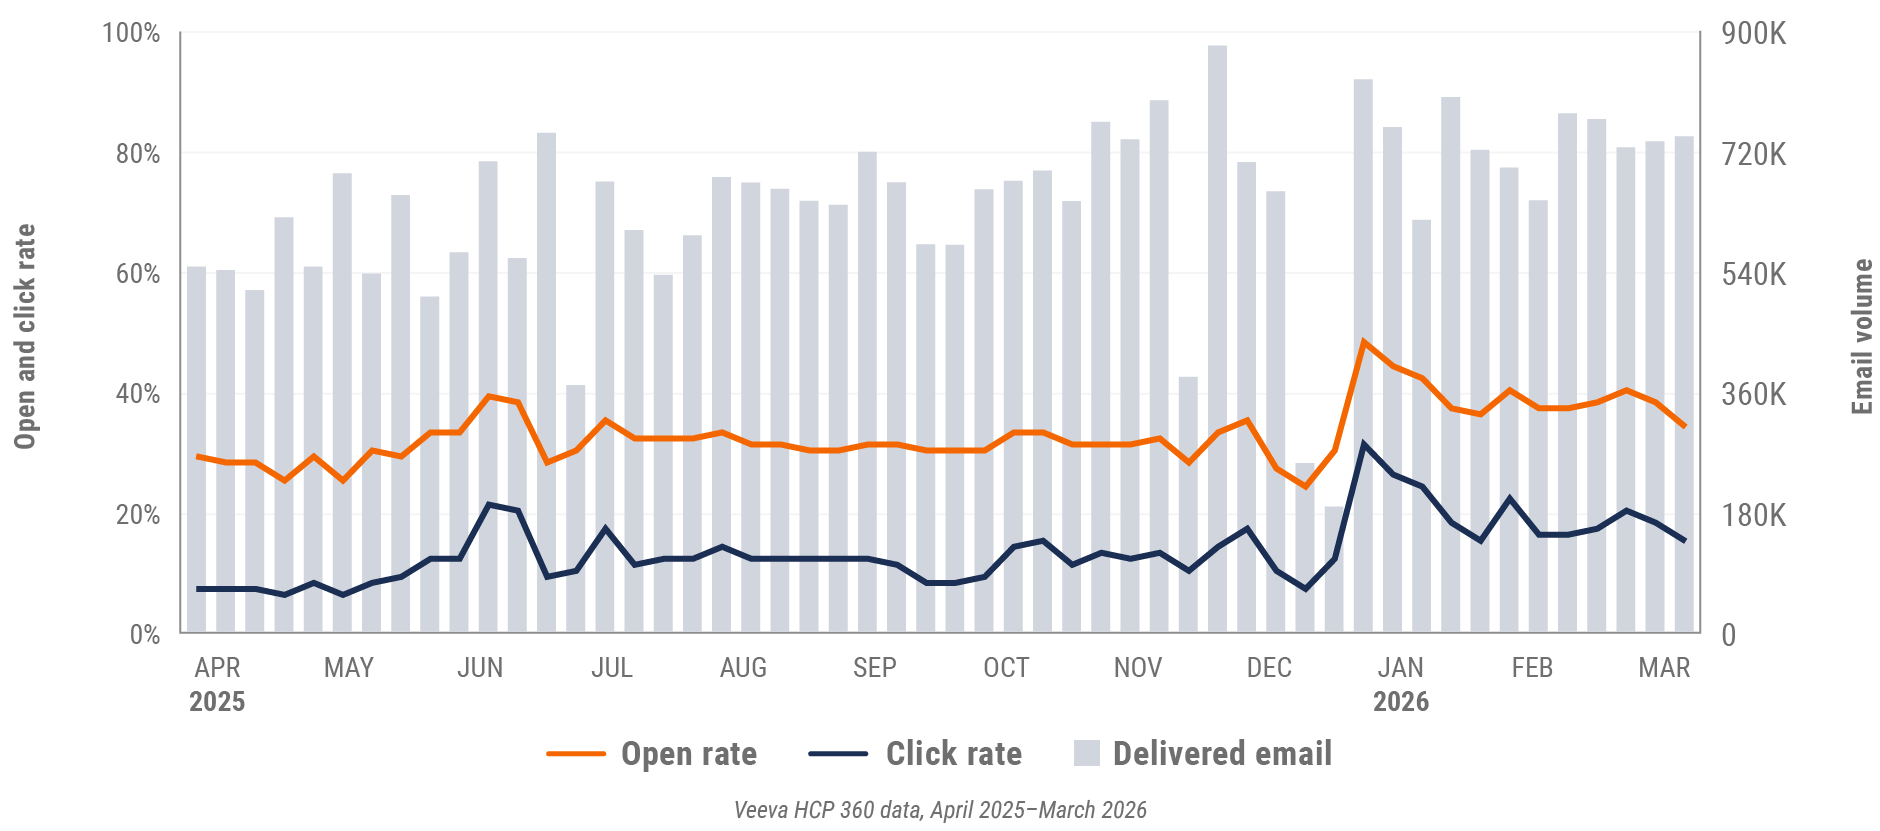
Figure 11: Content usage by channel, U.S.
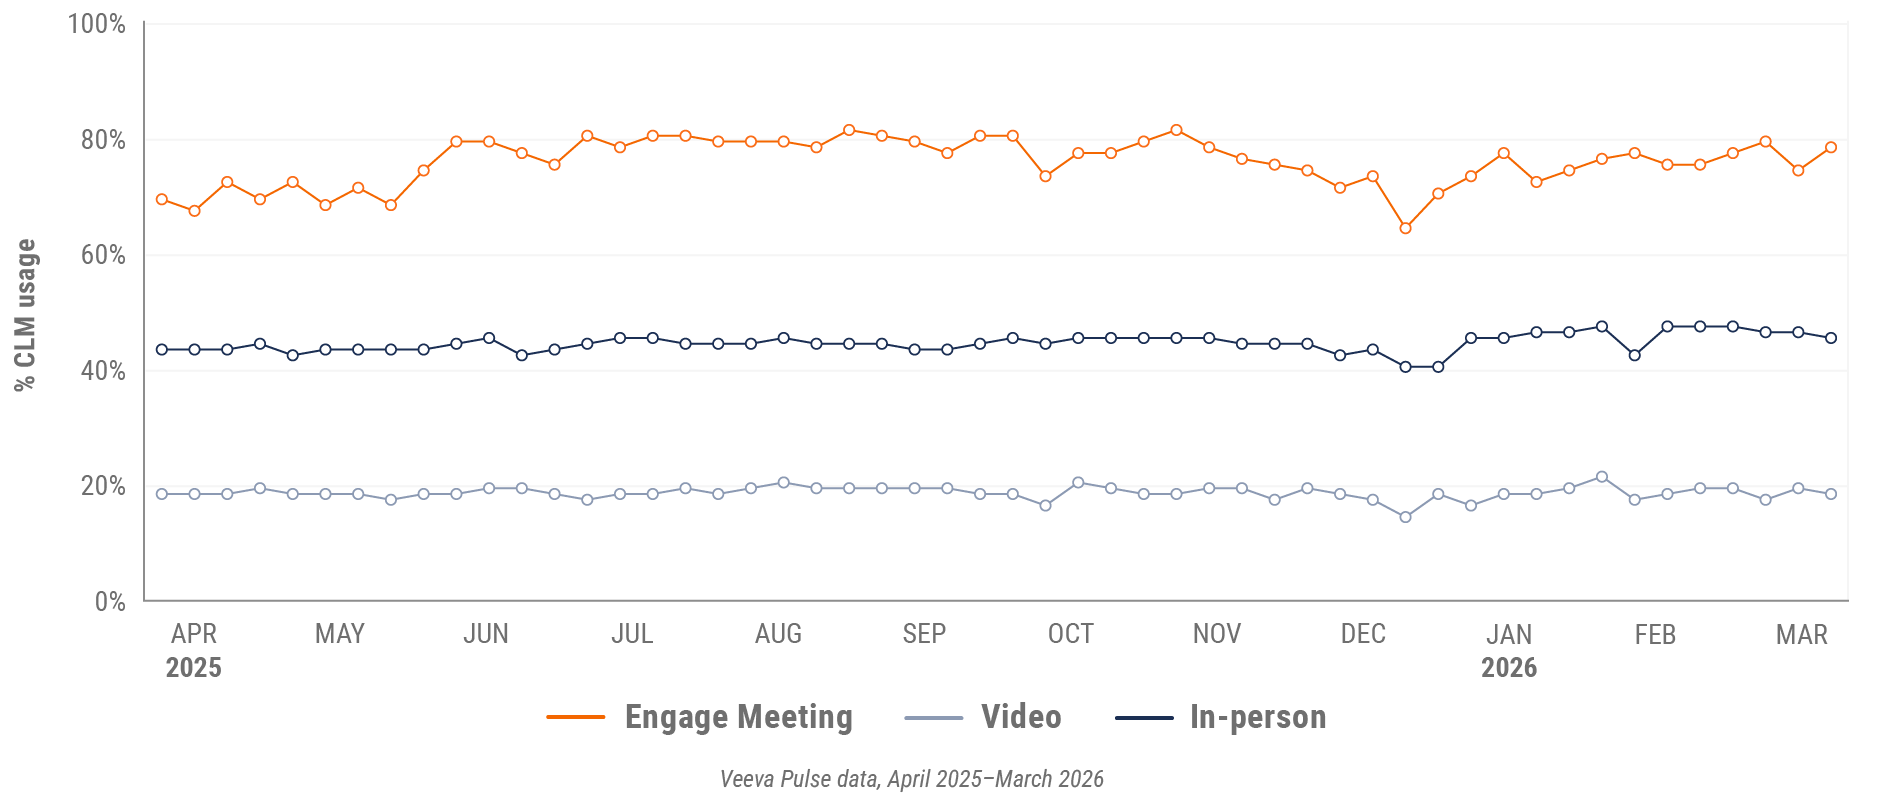
Figure 12: Veeva CRM Engage meeting duration, U.S.

Europe market trends
Figure 13: Channel mix evolution, Europe
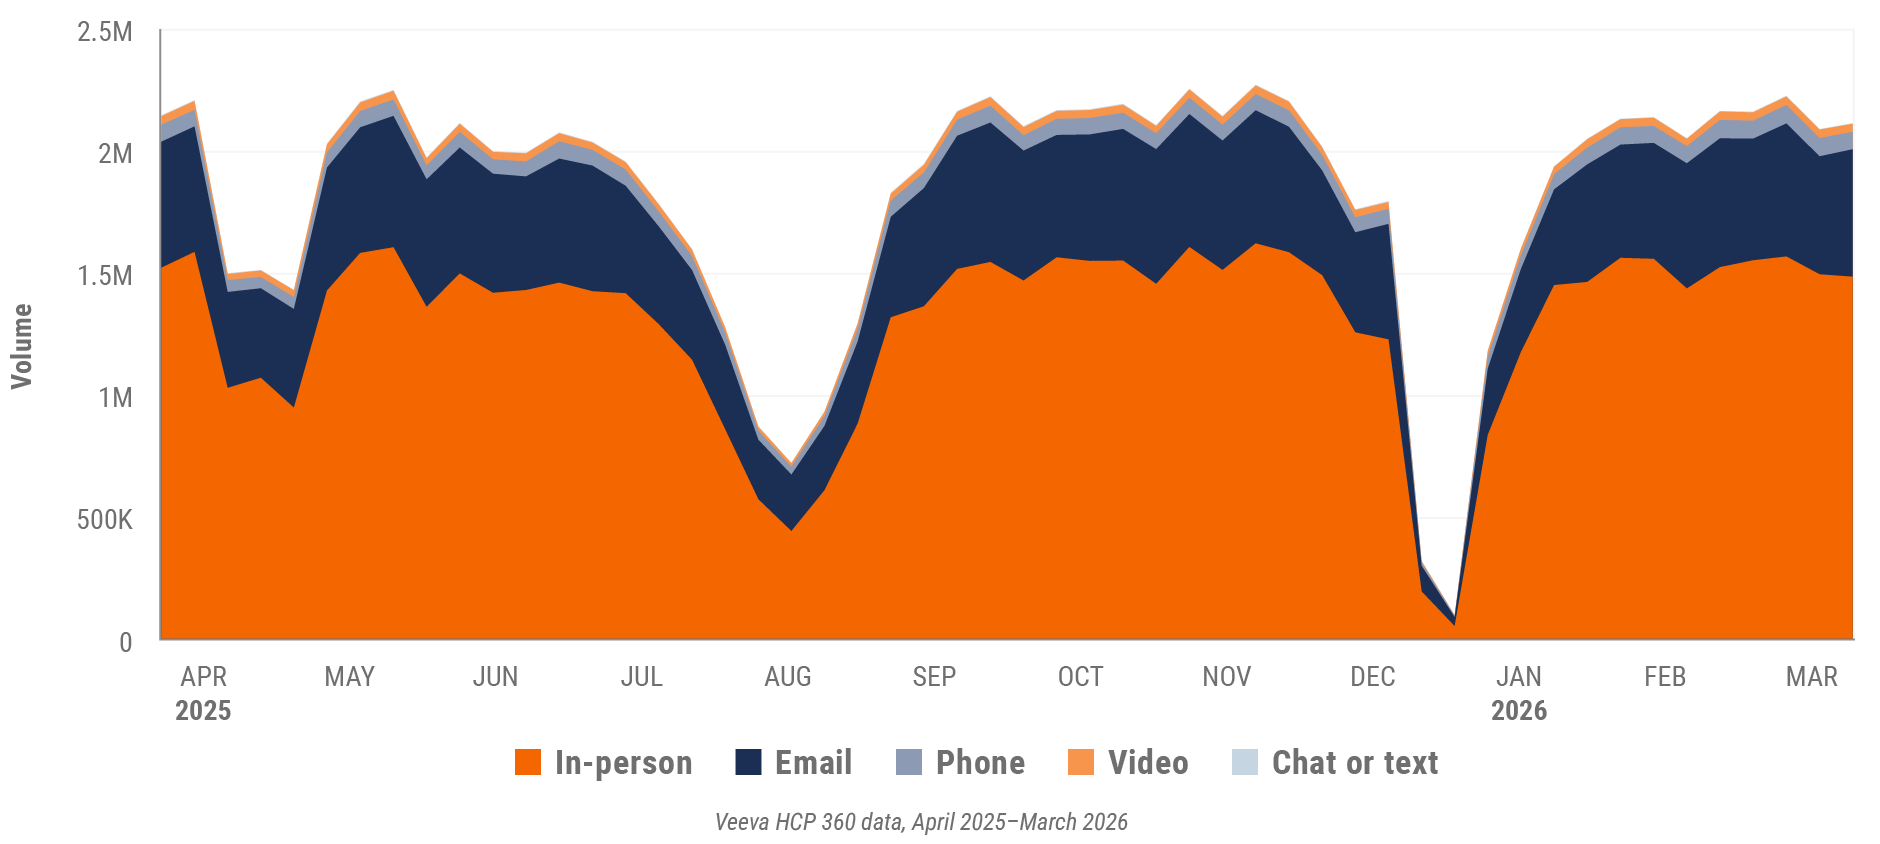
Figure 14: Channel mix, Europe
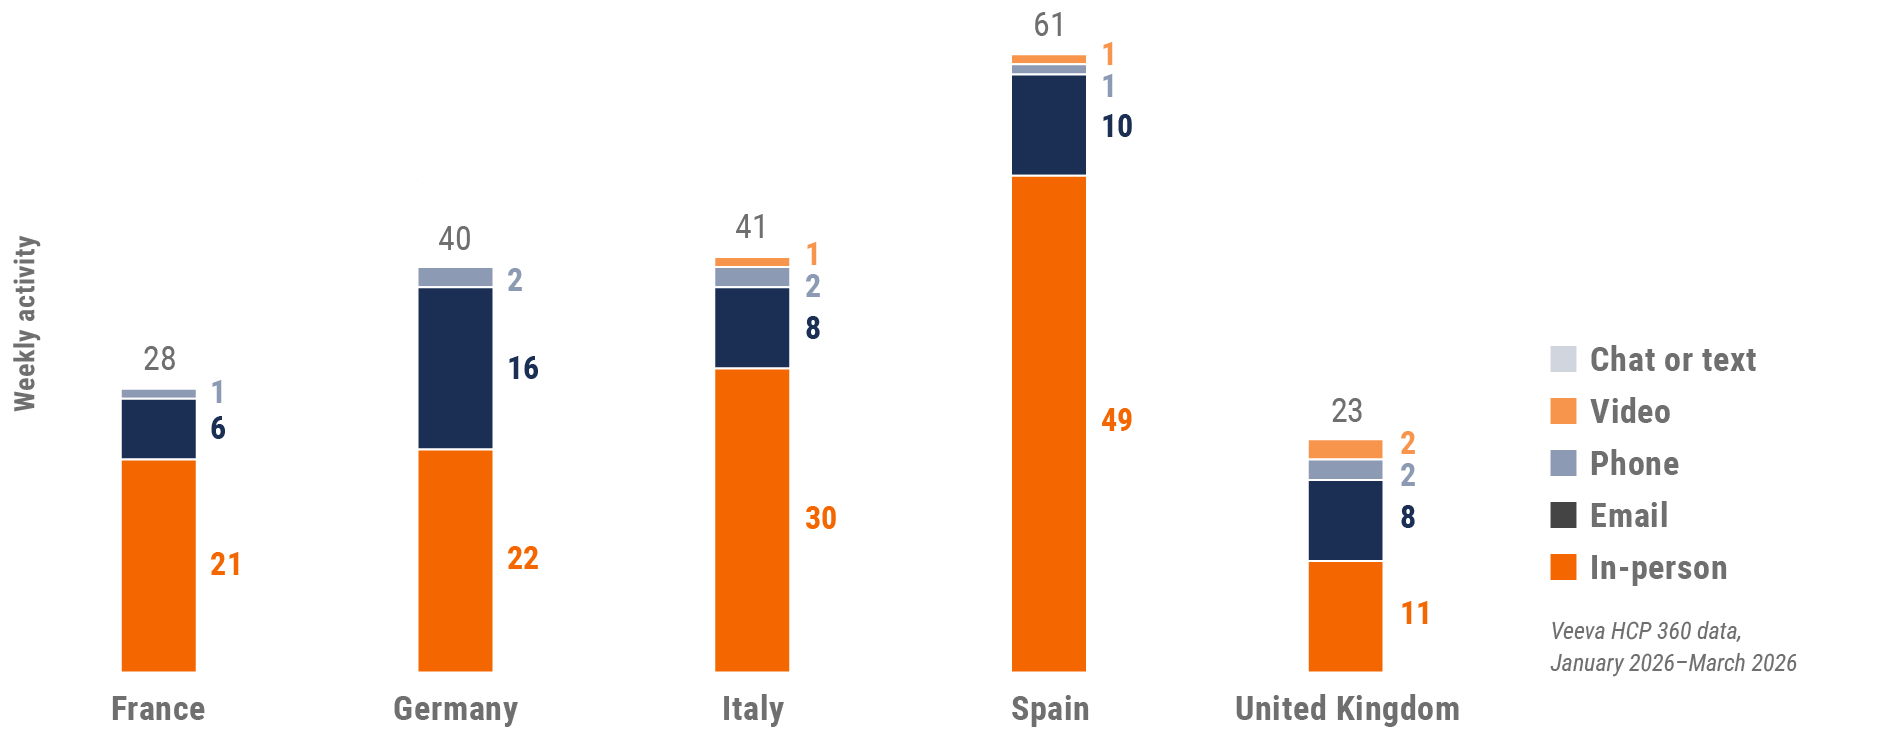
Europe field team activity Weekly activity per user by engagement channel
Figure 15: Activity by country, EU5
Europe engagement quality Consolidation of key quality metrics
Figure 16: Approved email volume, Europe
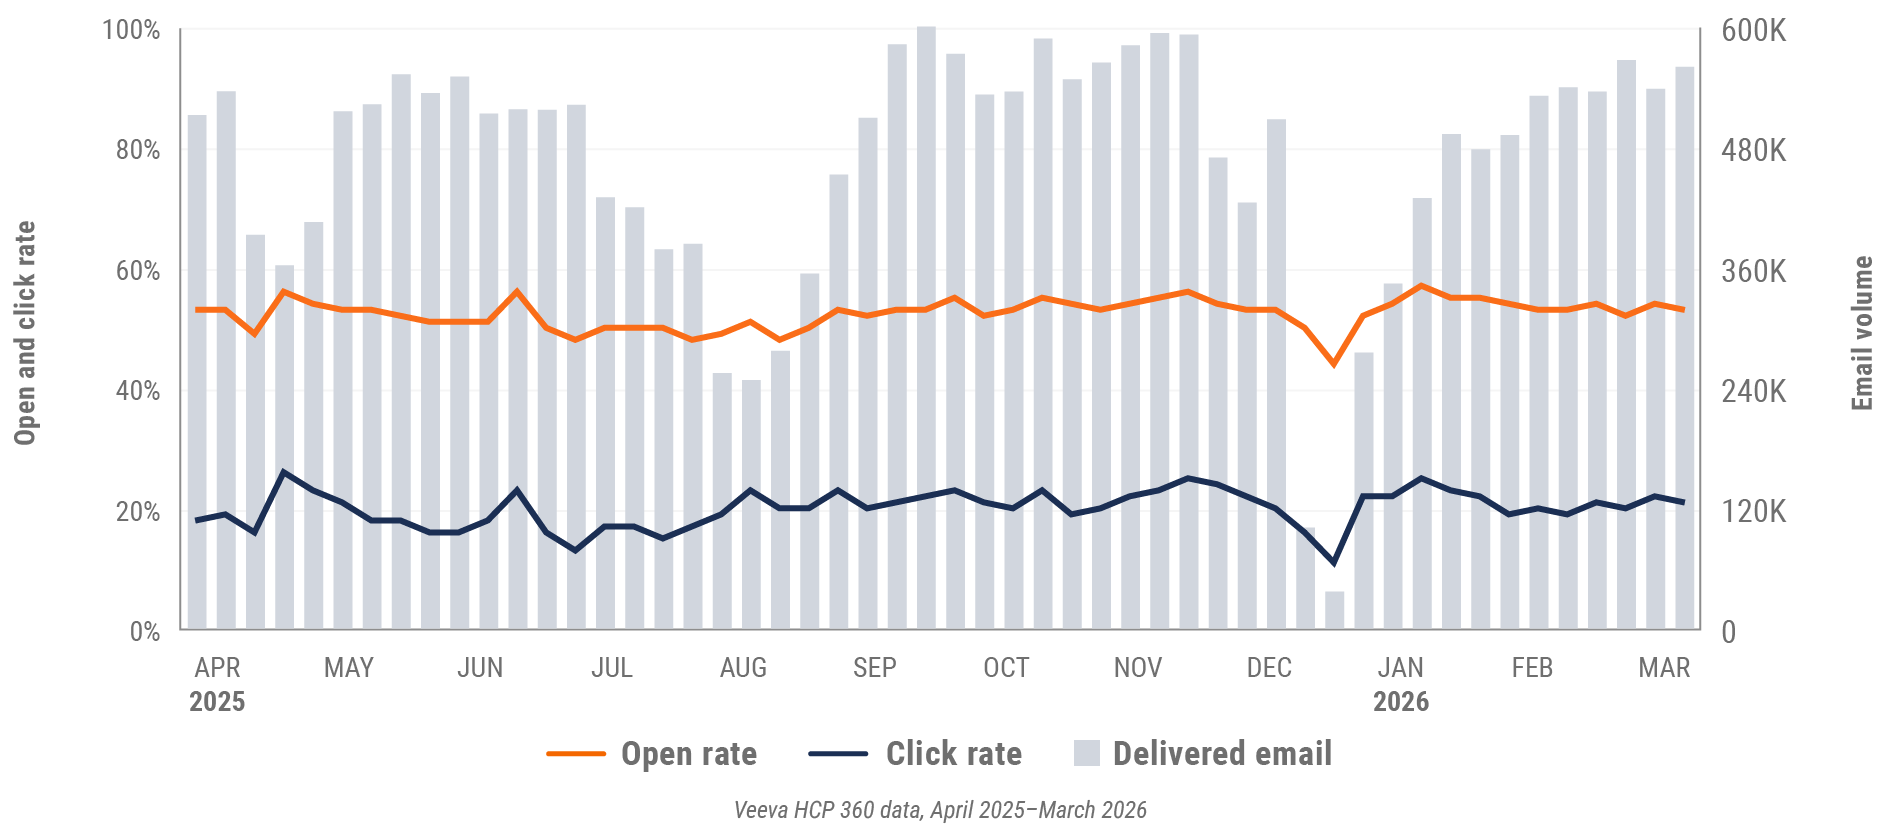
Figure 17: Content usage by channel, Europe
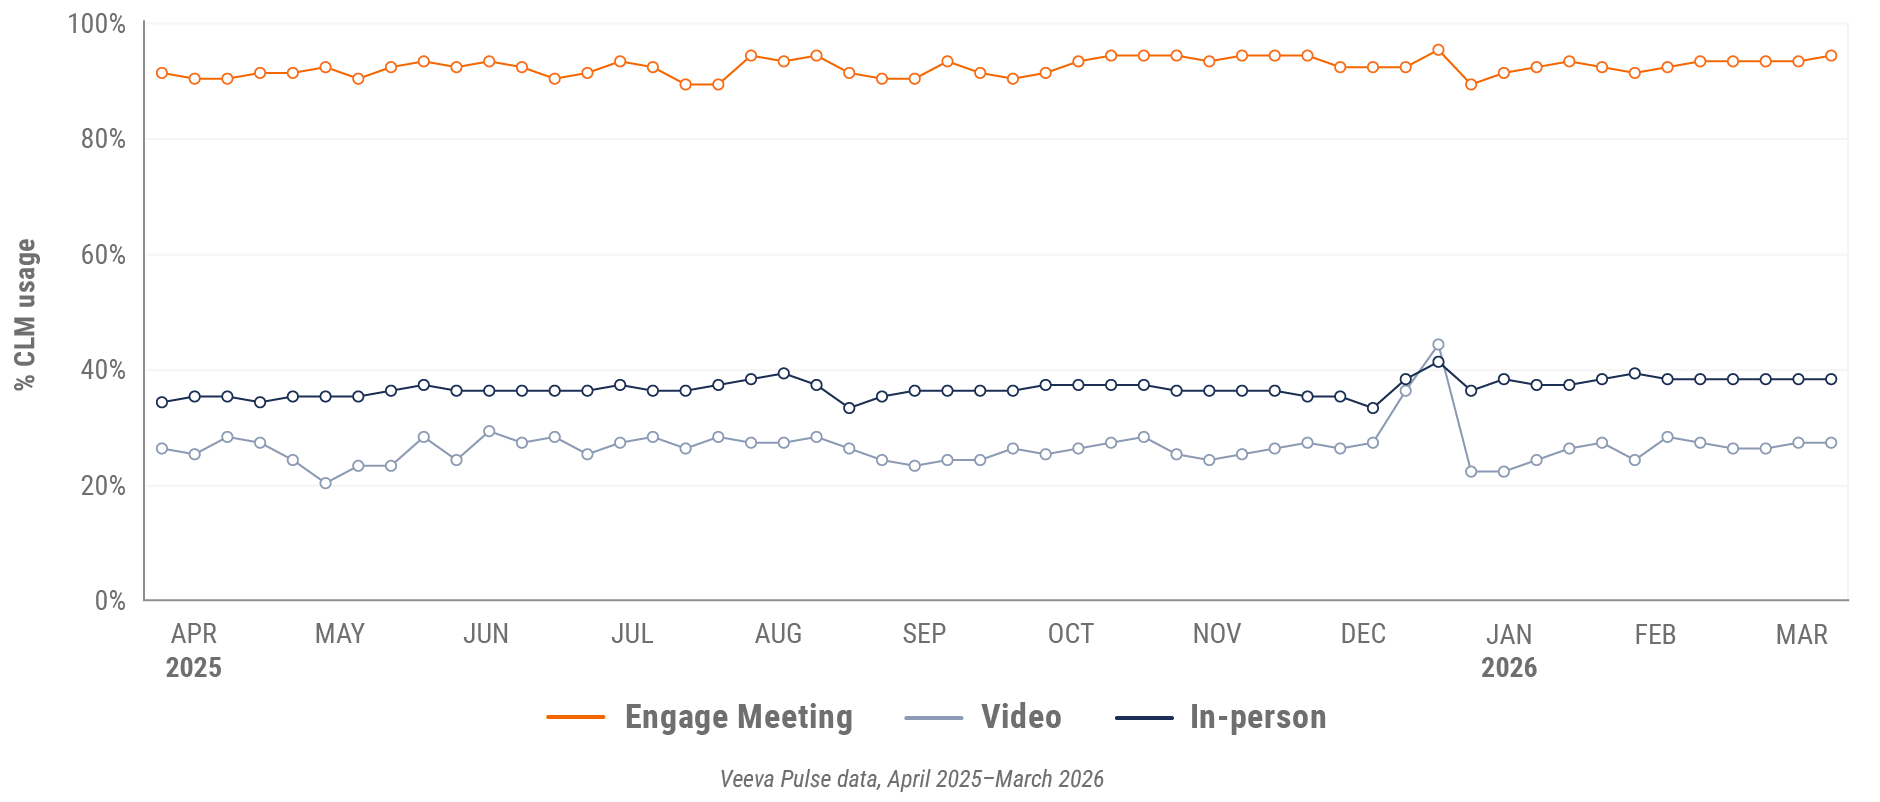
Figure 18: Veeva CRM Engage meeting duration, Europe

Asia market trends
Figure 19: Channel mix evolution, Asia
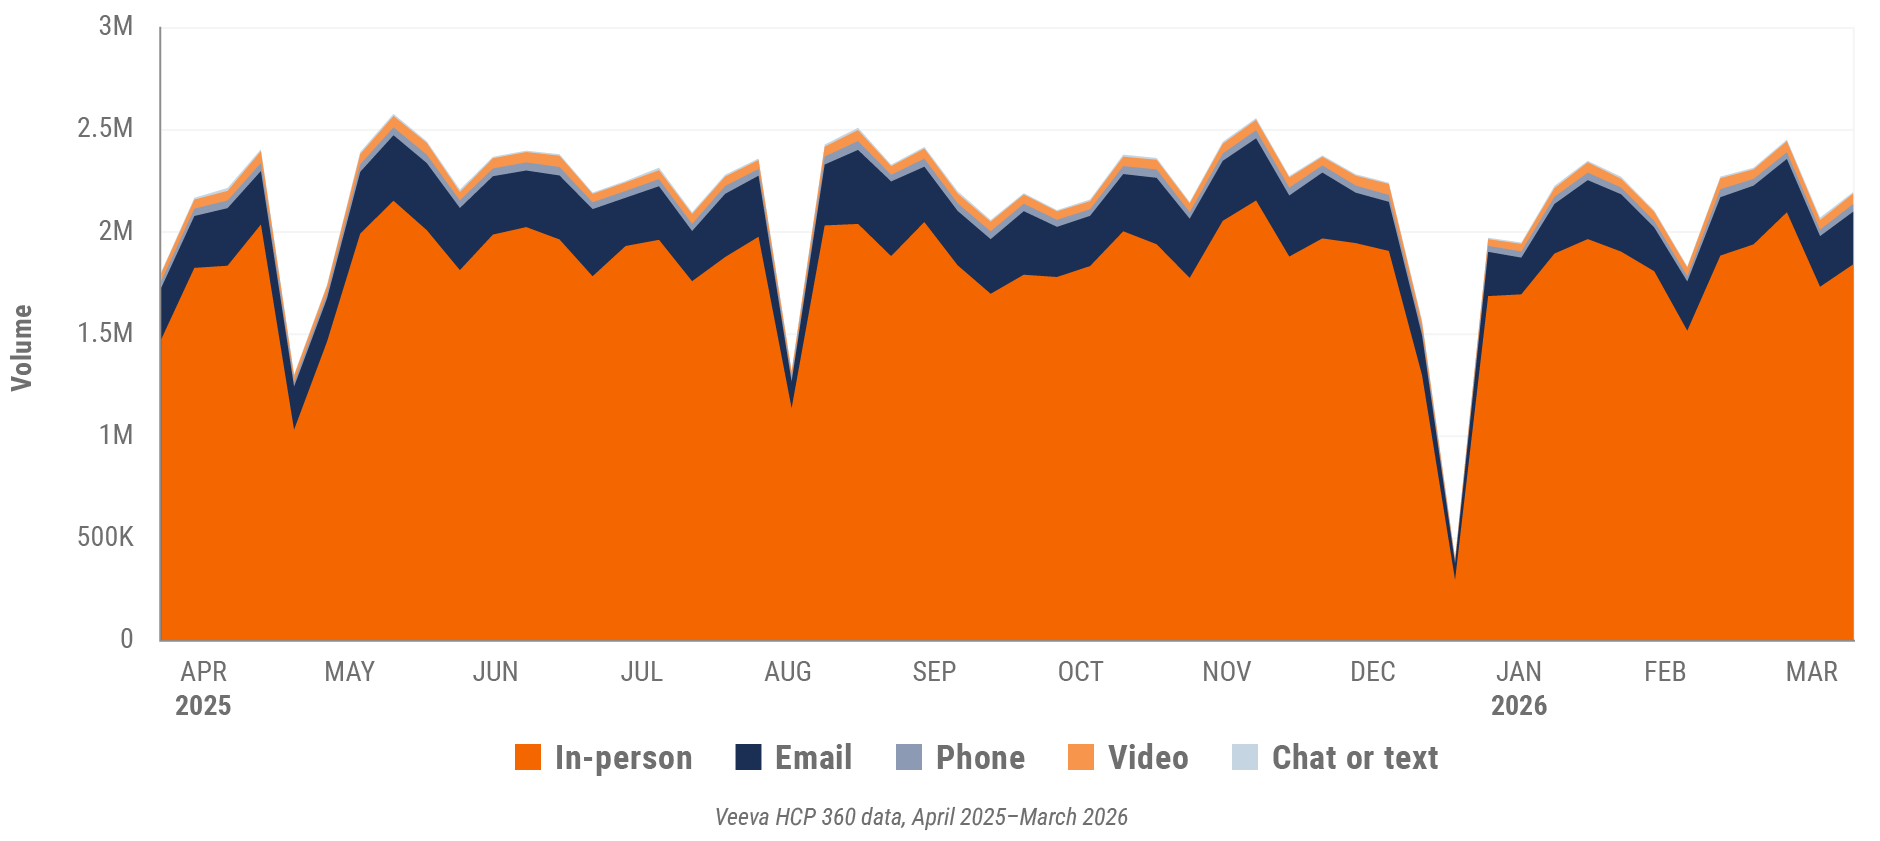
Figure 20: Channel mix, Asia
Asia field team activity Weekly activity per user by engagement channel
Figure 21: Activity by country, Asia
Asia engagement quality Consolidation of key quality metrics
Figure 22: Approved email volume, Asia
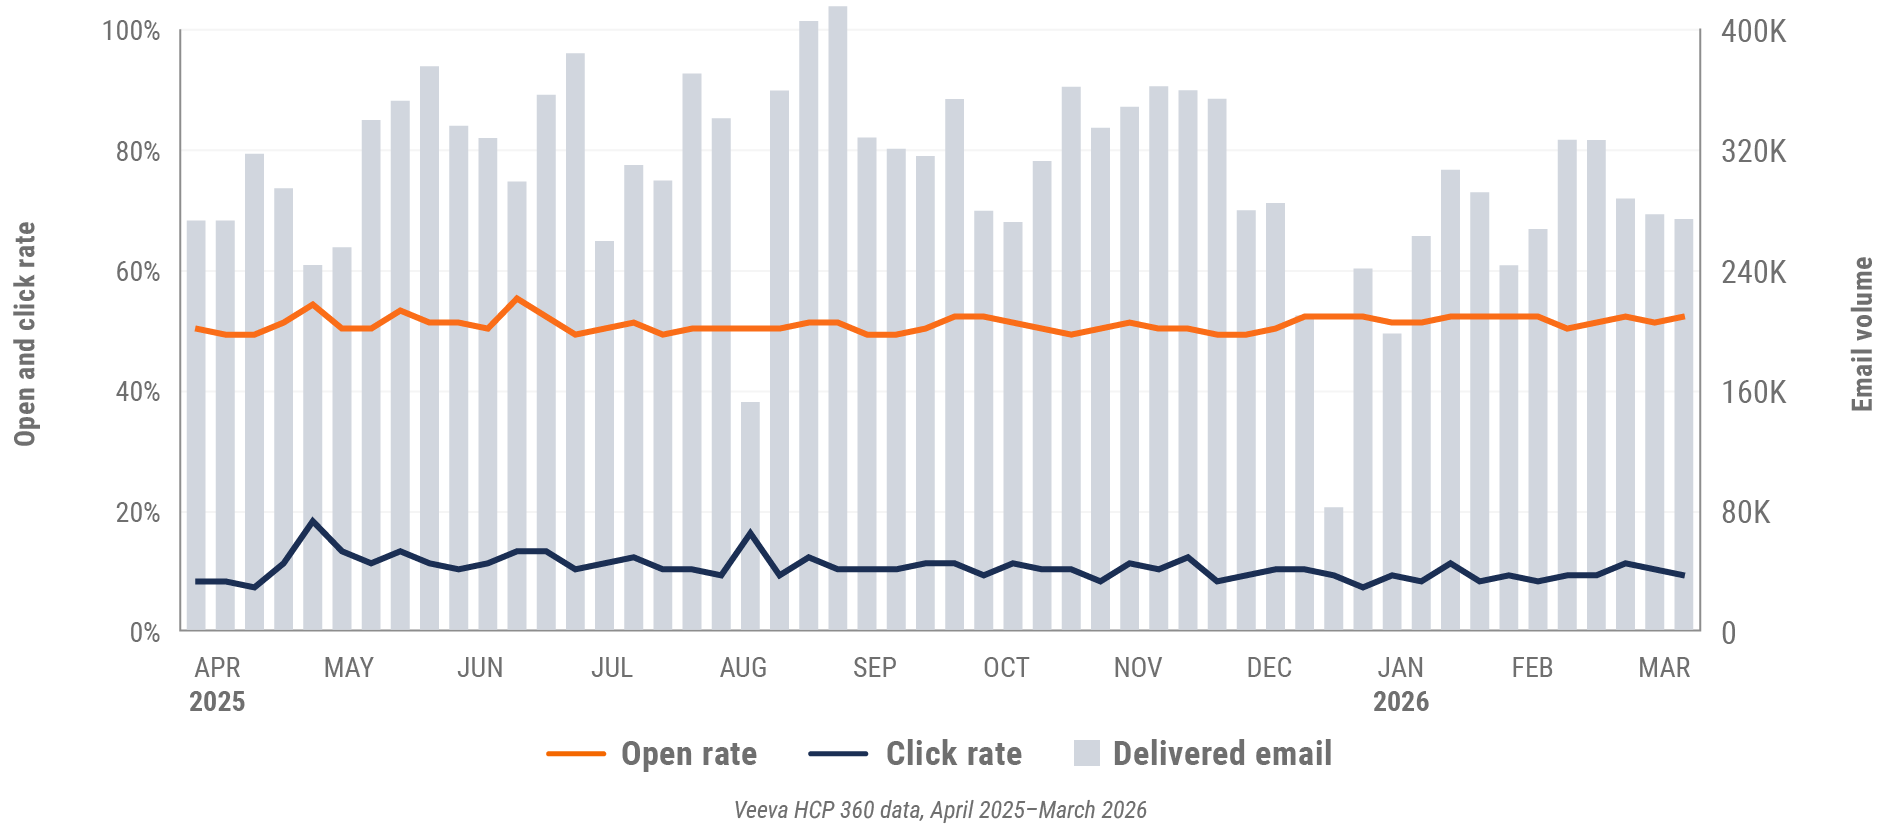
Figure 23: Content usage by channel, Asia
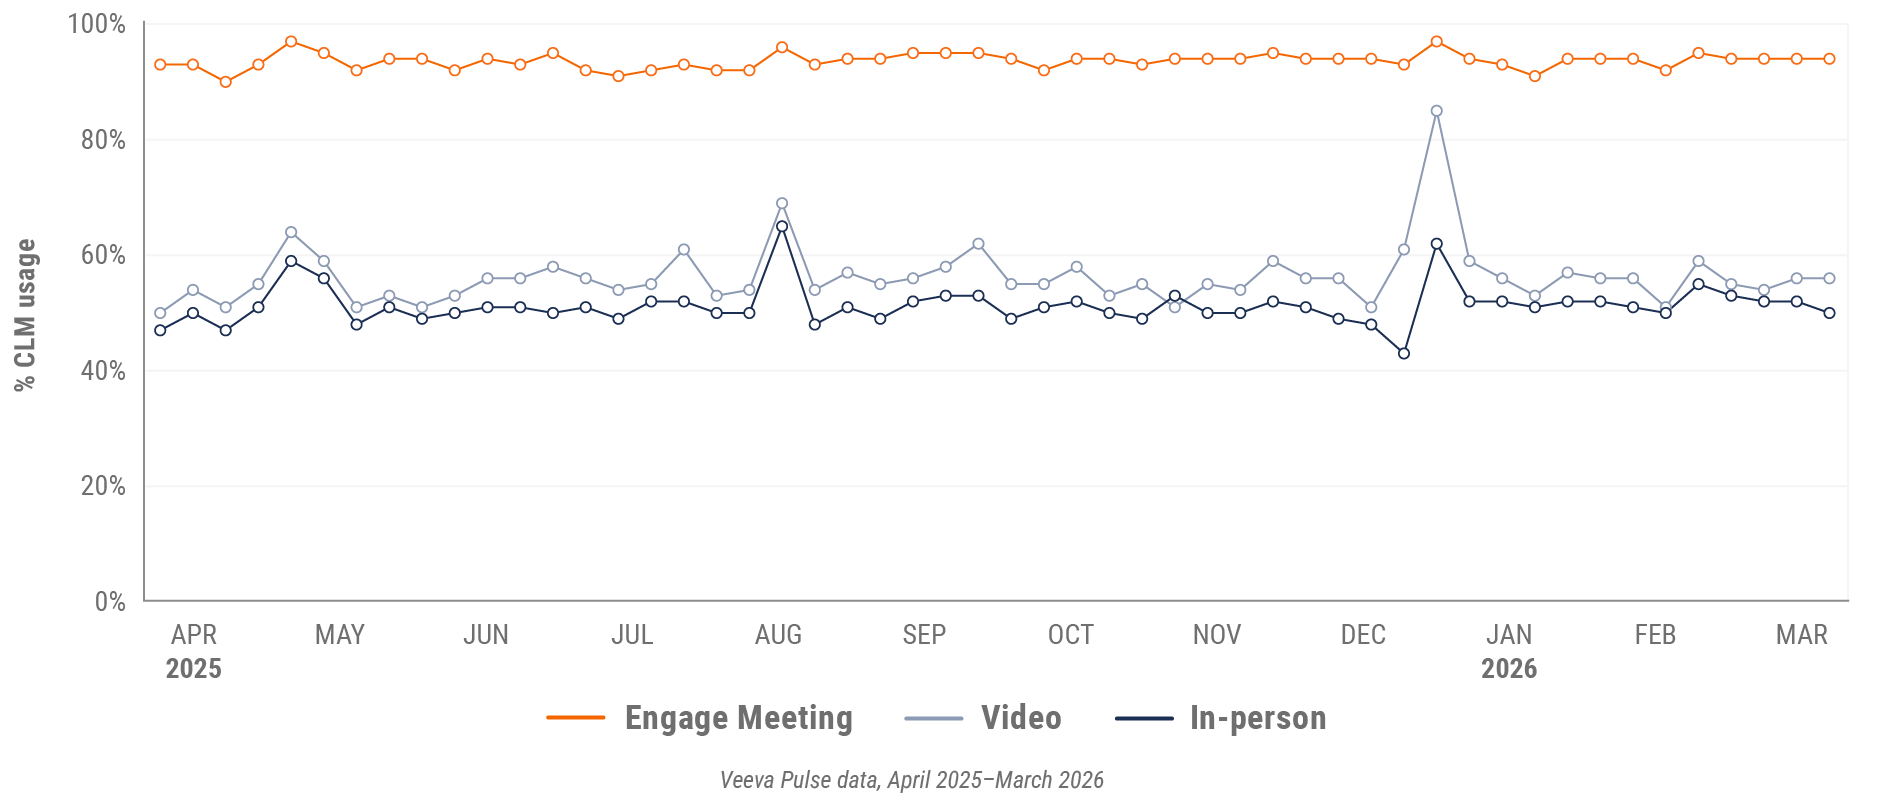
Figure 24: Veeva CRM Engage meeting duration, Asia

Latin America market trends
Figure 25: Channel mix evolution, Latin America
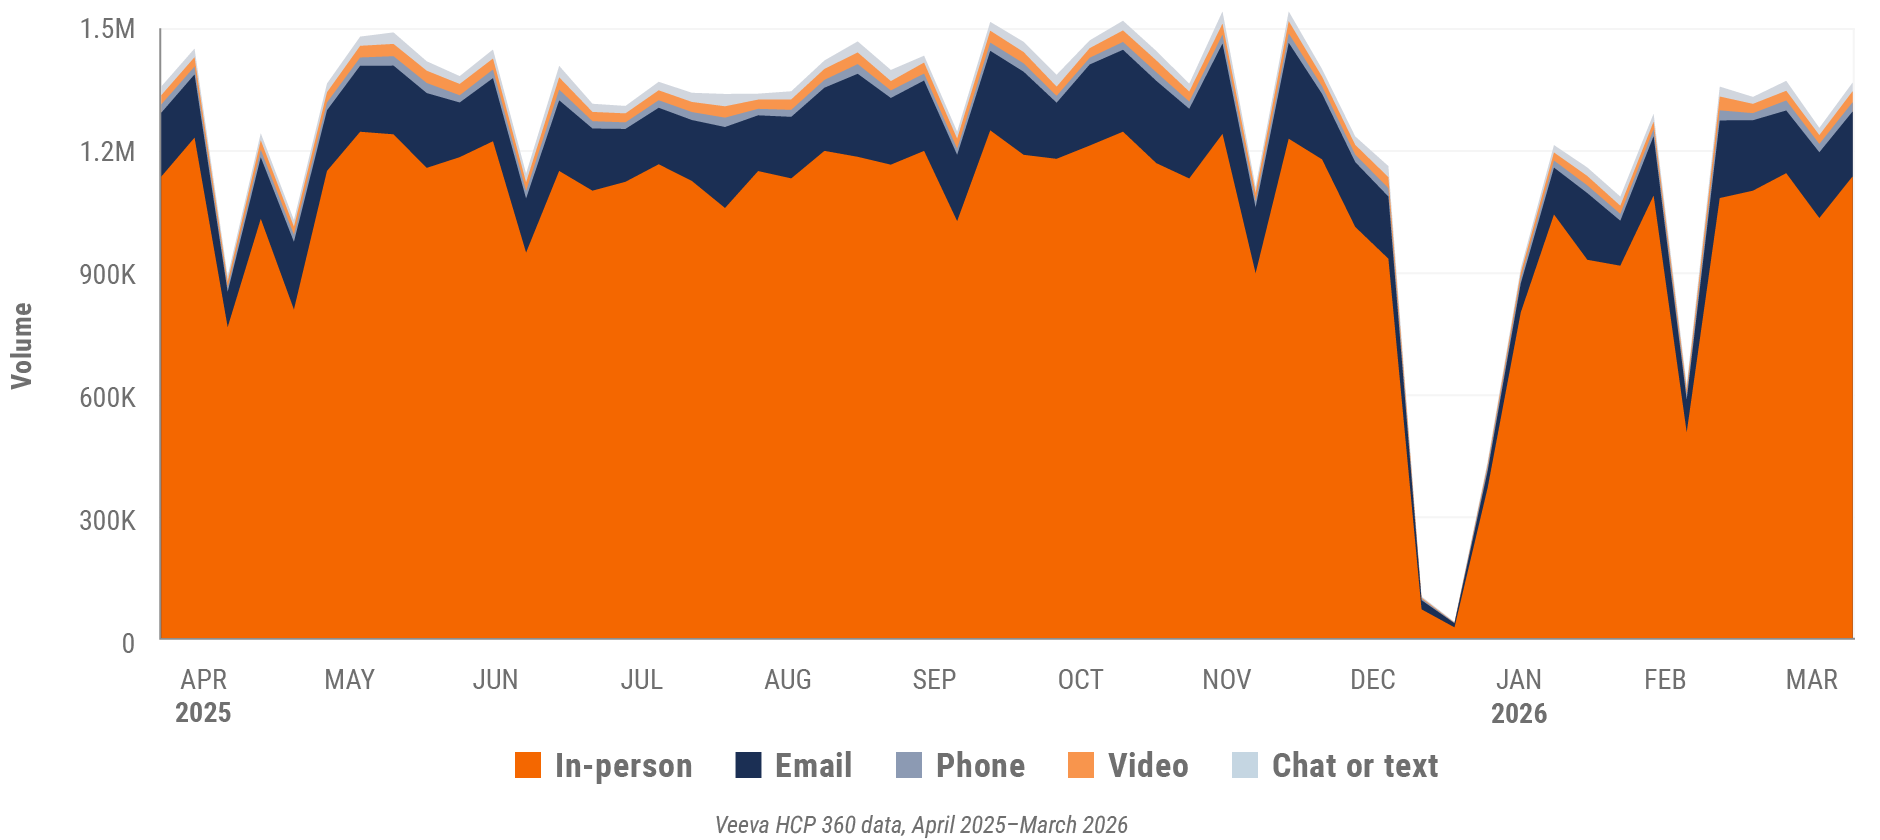
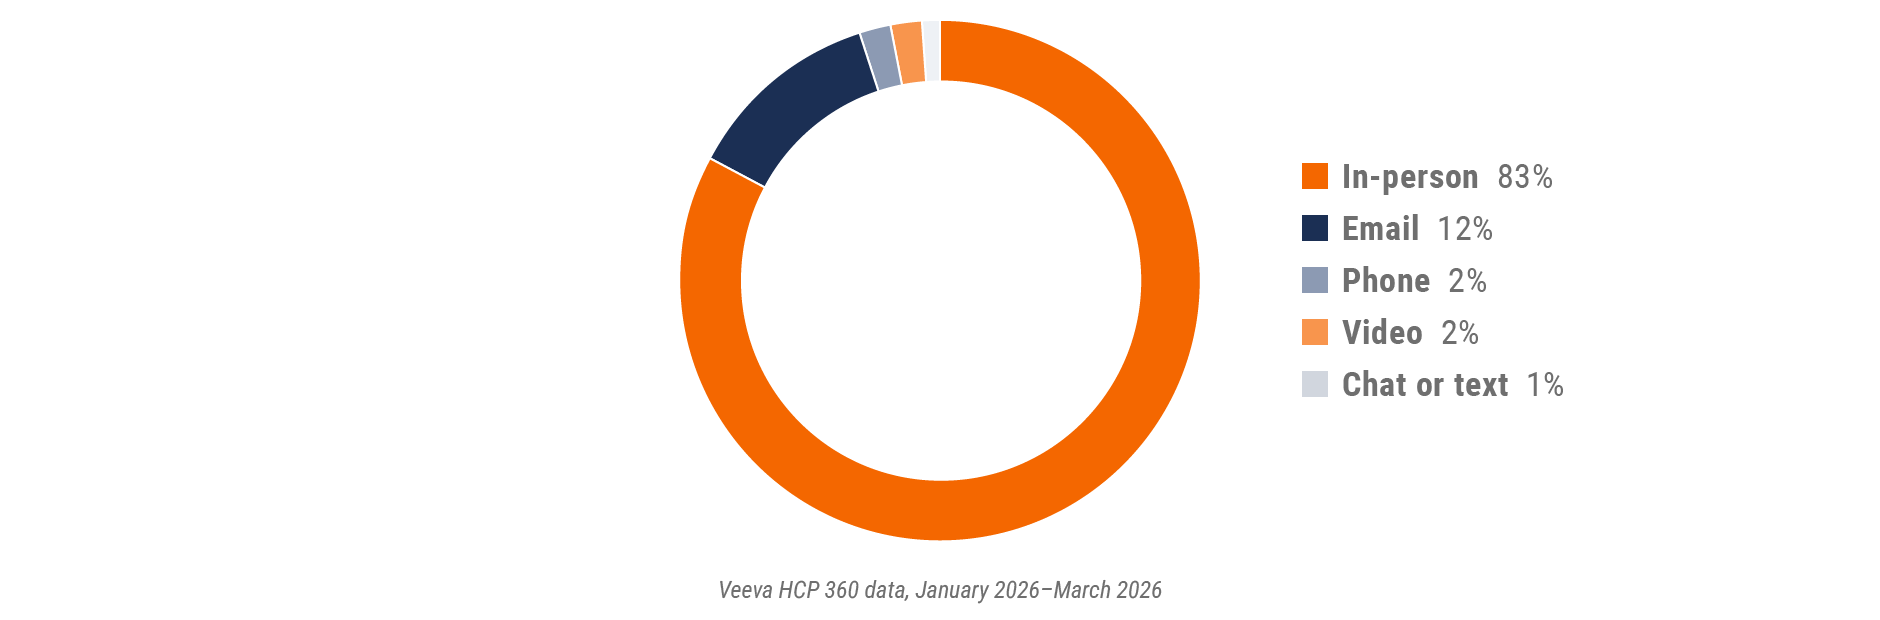
Figure 26: Channel mix, Latin America
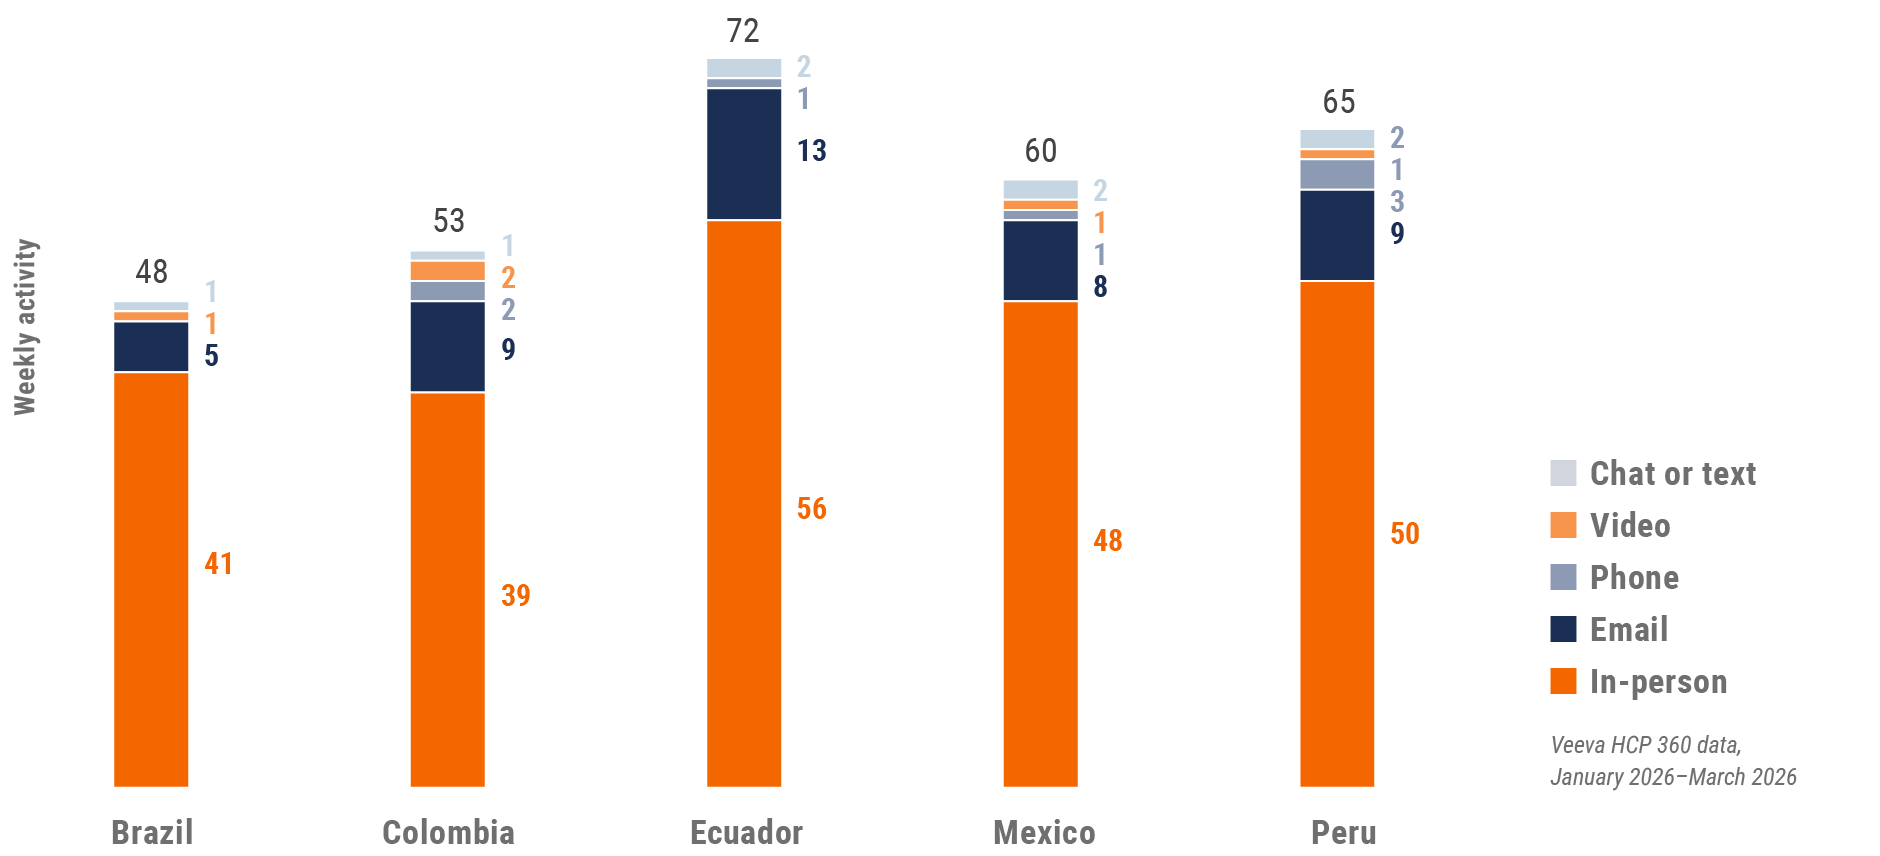
Latin America field team activity Weekly activity per user by engagement channel
Figure 27: Activity by country, Latin America
Latin America engagement quality Consolidation of key quality metrics
Figure 28: Approved email volume, Latin America
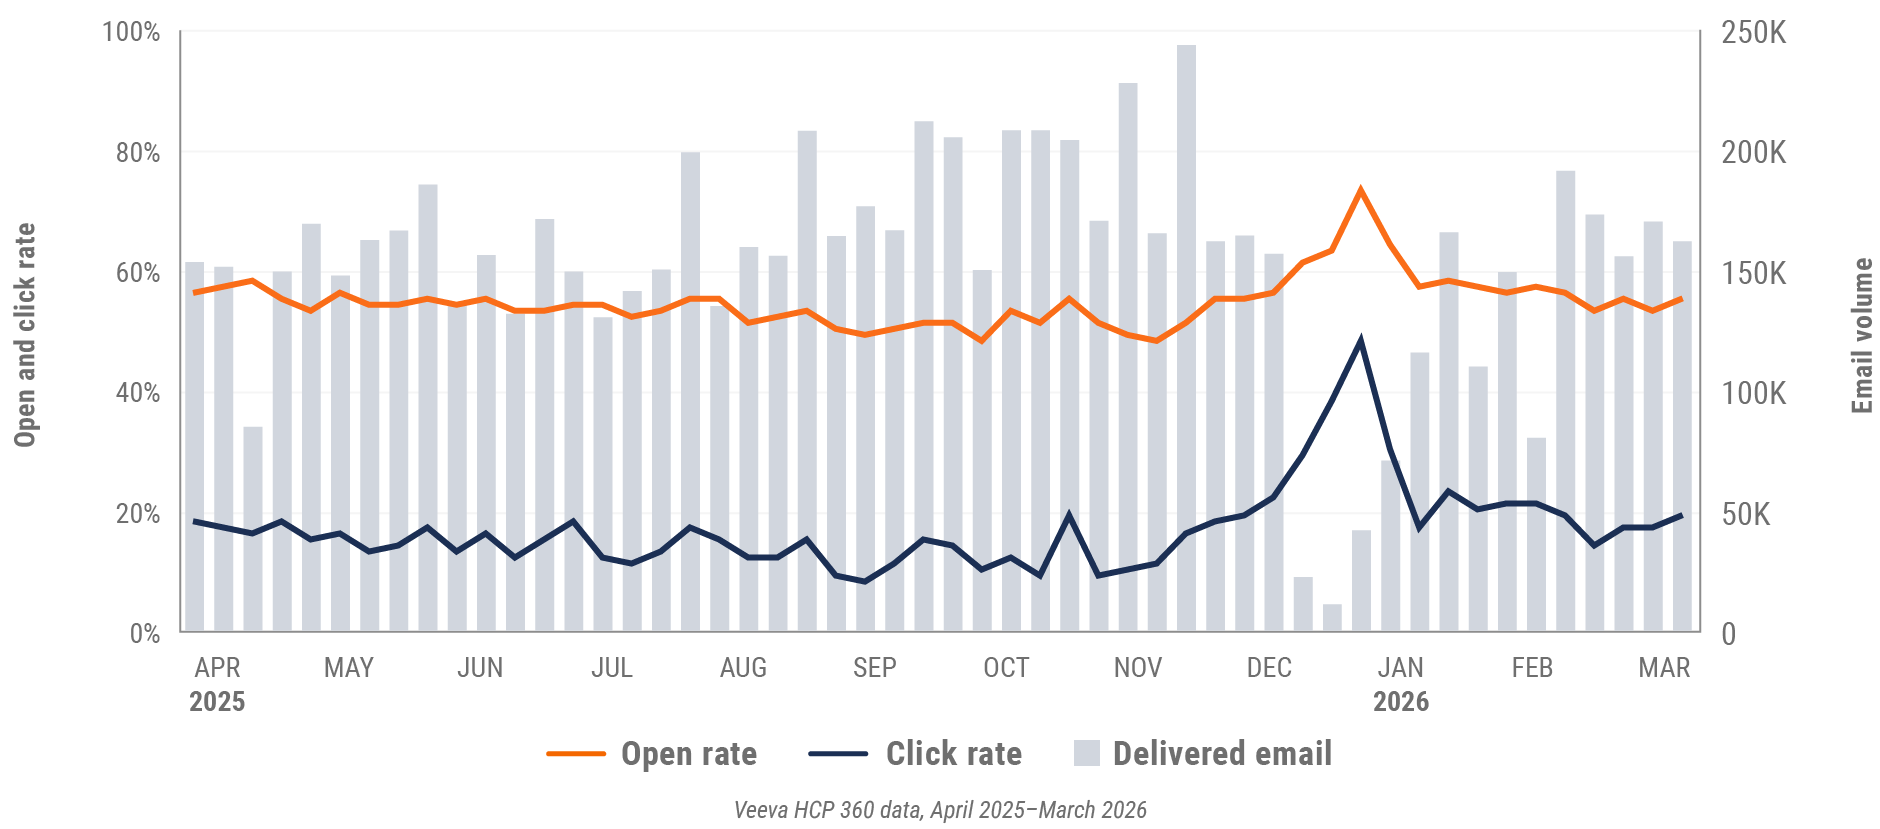
Figure 29: Content usage by channel, Latin America
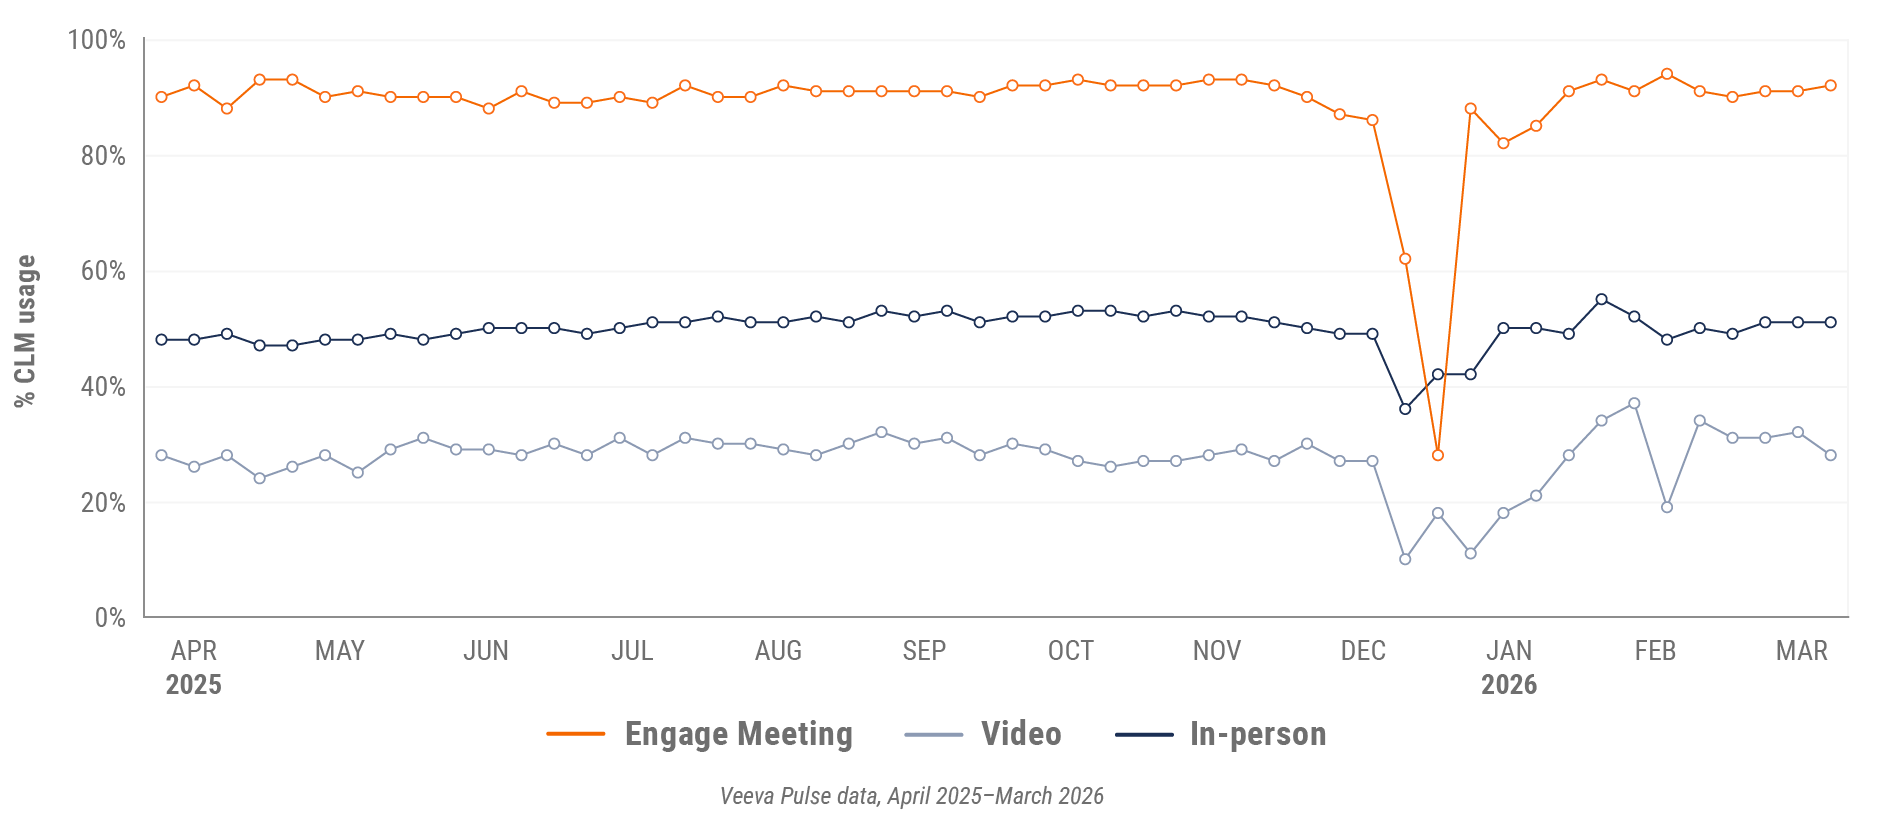
Figure 30: Veeva CRM Engage meeting duration, Latin America

Appendix: Data dictionary
Metric definitions
- Channel mix evolution over time: Weekly Veeva CRM activity volume broken down by the channel of engagement (in-person, phone, video, email, chat or text)
- Channel mix: Total Veeva CRM activity volume broken out by engagement channel percentage, calculated using percent change during the specified period
- Weekly activities per user: The average weekly number of Veeva CRM activities submitted per number of users active in Veeva CRM
- Approved email volume: The average weekly volume of approved emails sent via Veeva CRM, calculated using percent change during the specified period
- Email open rate: Percentage of approved emails opened at least once out of all approved emails sent via Veeva CRM
- Email click rate: Percentage of approved emails clicked at least once out of all approved emails sent via Veeva CRM
- In-person % CLM usage: Percentage of in-person engagements that leveraged content in Veeva CRM
- Video % CLM usage: Percentage of video engagements that leveraged content in Veeva CRM
- Veeva CRM Engage meeting % CLM usage: Percentage of Veeva CRM Engage meetings that leveraged content in Veeva CRM
- Veeva CRM Engage meeting duration: The average duration of Veeva CRM Engage meetings in minutes
Engagement channel definitions
- In-person: Submitted calls with a CRM Standard Metrics call channel value of ‘in-person’
- Phone: Submitted calls with a CRM Standard Metrics call channel value of ‘phone’
- Video: Veeva CRM Engage calls and video calls via other platforms that are then recorded as calls in Veeva CRM with a Standard Metrics call channel value of ‘video’
- Email: Approved emails and emails sent via other platforms that are then recorded as calls in Veeva CRM with a Standard Metrics call channel value of ‘email’
- Chat or text: Submitted calls with a CRM Standard Metrics call channel value of ‘chat or text’
Region definitions
- Global: All markets globally except China
- Europe: Albania, Andorra, Armenia, Aruba, Austria, Azerbaijan, Belarus, Belgium, Bermuda, Bosnia and Herzegovina, Bulgaria, Croatia, Cyprus, Czech Republic, Denmark, Estonia, Finland, France, French Polynesia, Georgia, Germany, Greece, Greenland, Guadeloupe, Guernsey, Hungary, Ireland, Italy, Jersey, Latvia, Lithuania, Luxembourg, Macedonia, Malta, Martinique, Republic of Moldova, Monaco, Montenegro, Netherlands, New Caledonia, Norway, Poland, Portugal, Romania, Serbia, Slovakia, Slovenia, Spain, Sweden, Switzerland, Ukraine, United Kingdom
- Asia: Australia, Bangladesh, Bhutan, Brunei Darussalam, Cambodia, Cocos (Keeling) Islands, Indonesia, Japan, Kazakhstan, Republic of Korea, Kyrgyzstan, Malaysia, Mongolia, Myanmar, Nauru, Nepal, New Zealand, Philippines, Samoa, Singapore, Solomon Islands, Sri Lanka, Taiwan, Tajikistan, Thailand, Turkmenistan, Uzbekistan, Vietnam
- Latin America: Antigua and Barbuda, Argentina, Bahamas, Barbados, Belize, Bolivia, Brazil, Chile, Colombia, Costa Rica, Cuba, Dominican Republic, Ecuador, El Salvador, Guatemala, Guyana, Haiti, Honduras, Jamaica, Mexico, Nicaragua, Panama, Paraguay, Peru, Trinidad and Tobago, Uruguay, Venezuela
Methodology
The Veeva Agentic Commercial Trends Report is a quarterly industry benchmark for global and regional healthcare professional (HCP) engagement across the life sciences industry. The findings are based on:
- Approximately 600 million annual global field activities captured in Veeva CRM and Veeva CRM Engage.
- Marketing effectiveness data from Veeva Crossix. Crossix connects anonymized health data on 300+ million patients to media data to measure the impact of direct-to-consumer and HCP marketing investments in the U.S.
- Anonymous patient longitudinal claims data from Veeva Compass Patient covering dispensed prescriptions, procedures, and diagnoses from 300+ million patients.
- 4+ million profiles containing publications, clinical trials, conferences, associations, guidelines, grants, payments, social media, news mentions, and patient mix by disease and drug class from Veeva Link Key People in 85+ countries and all major therapeutic areas.
- Global reference data of HCPs, healthcare organizations, and affiliations from Veeva OpenData, containing addresses, emails, specialties, demographics, and compliance data (license information and industry identifiers) in 100+ countries.
The Veeva Agentic Commercial Trends Report delivers insights that inform the industry and help field teams align their strategy to key market trends for improved commercial success. The global Veeva Business Consulting team also helps customers inform their strategies using industry benchmarking with Veeva Agentic Commercial Trends data.